


use of funds slides
Description
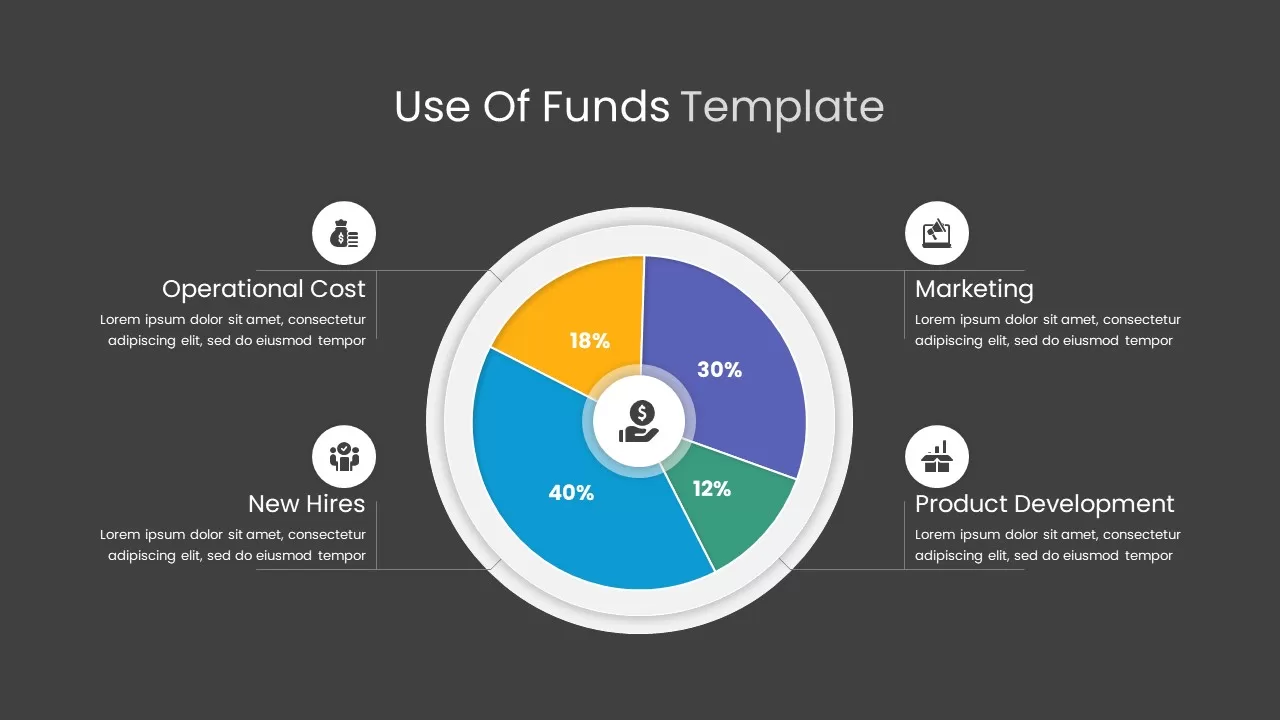
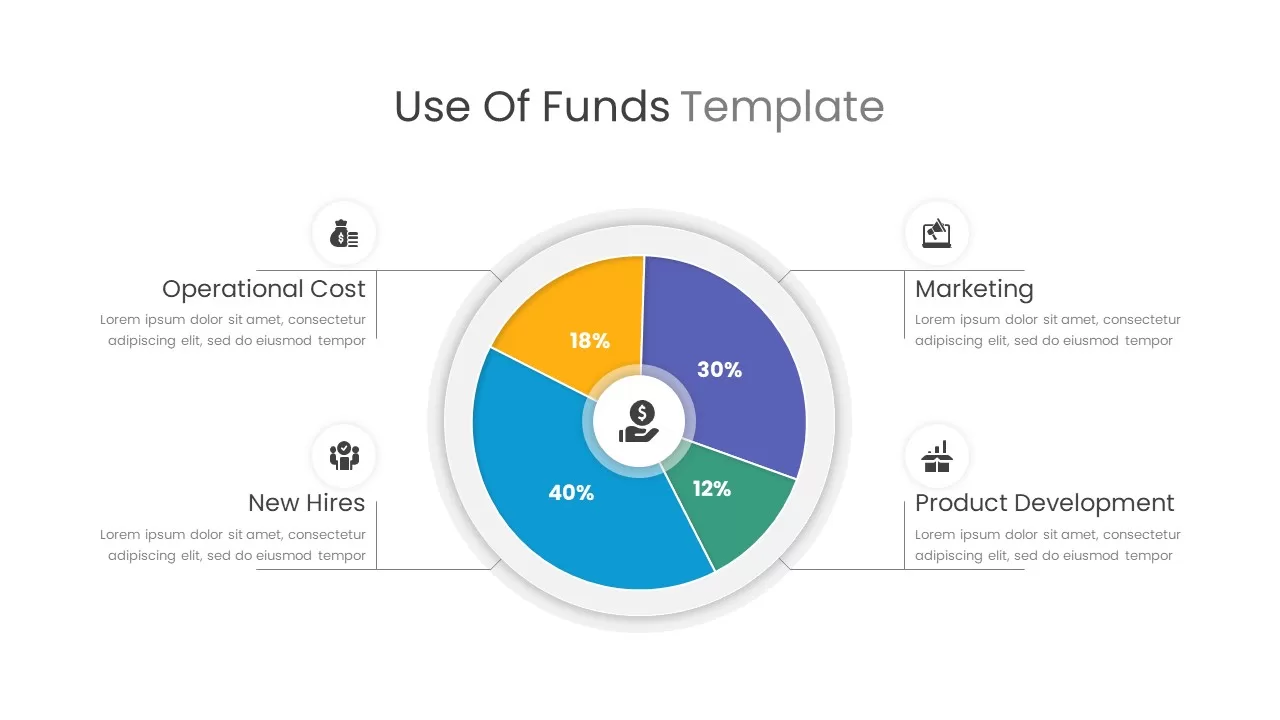
Effortlessly illustrate budget distribution with this use-of-funds donut chart slide, enabling audiences to grasp allocation at a glance. A central circular infographic features four vividly colored segments—new hires (40%), marketing (30%), operational costs (18%), and product development (12%)—each with clear percentage labels. Connector lines link slices to text blocks and icon placeholders, offering contextual details that reinforce financial insights.
Built on fully editable master slides, every element can be customized in seconds without disrupting layout harmony. Swap icons by dragging and dropping new graphics, update segment labels in-line, and apply brand-specific color swatches using the built-in palette. Auto-align guides, grouping features, and locked layers ensure consistent spacing and alignment when you reposition or resize segments, preserving the slide’s professional aesthetic through rapid iterations.
Optimize audience engagement with preset entrance and emphasis animations that sequentially reveal each chart segment or connector line. High-resolution vector assets maintain crisp visuals across large-format displays, local projectors, and remote-call screens. The slide automatically preserves alignment and formatting between PowerPoint and Google Slides, eliminating version-control issues and export errors. Seamlessly scale the infographic for print collateral or dashboards without quality loss, thanks to fully vector-based design.
Whether you’re presenting venture capital allocations, departmental budgets, or nonprofit funding proposals, this use-of-funds donut chart provides a clear, compelling framework for financial storytelling. Leverage the versatile layout for quarterly reports, board meetings, or investor pitches, and adapt the slide’s modular segments to suit any funding scenario in seconds.
Designed for versatility, you can quickly add or remove segments to match any number of cost centers, export the infographic for executive summaries, or integrate it into broader pitch decks seamlessly.
Who is it for
Financial analysts, CFOs, and budgeting teams will benefit from this slide when presenting fund allocation, departmental spending, or capital deployment plans. Startup founders, nonprofit directors, and board members can also leverage it to communicate resource distribution and funding priorities.
Other Uses
Repurpose this infographic for expense breakdowns, revenue source analyses, grant distribution maps, or campaign budget overviews. Use the circular framework to depict market share, resource allocation, or performance metrics in any business context.
Login to download this file

Item ID
SB02303