


Puzzle Piece Infographics Dark
Description
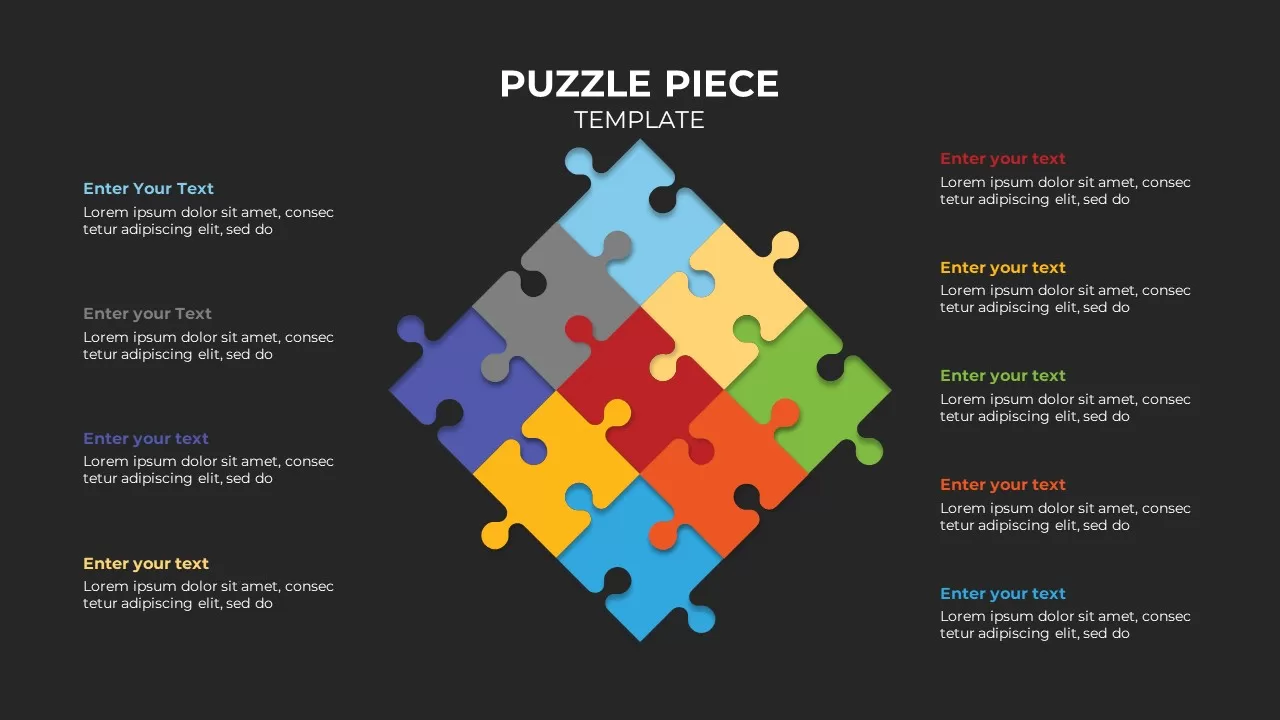
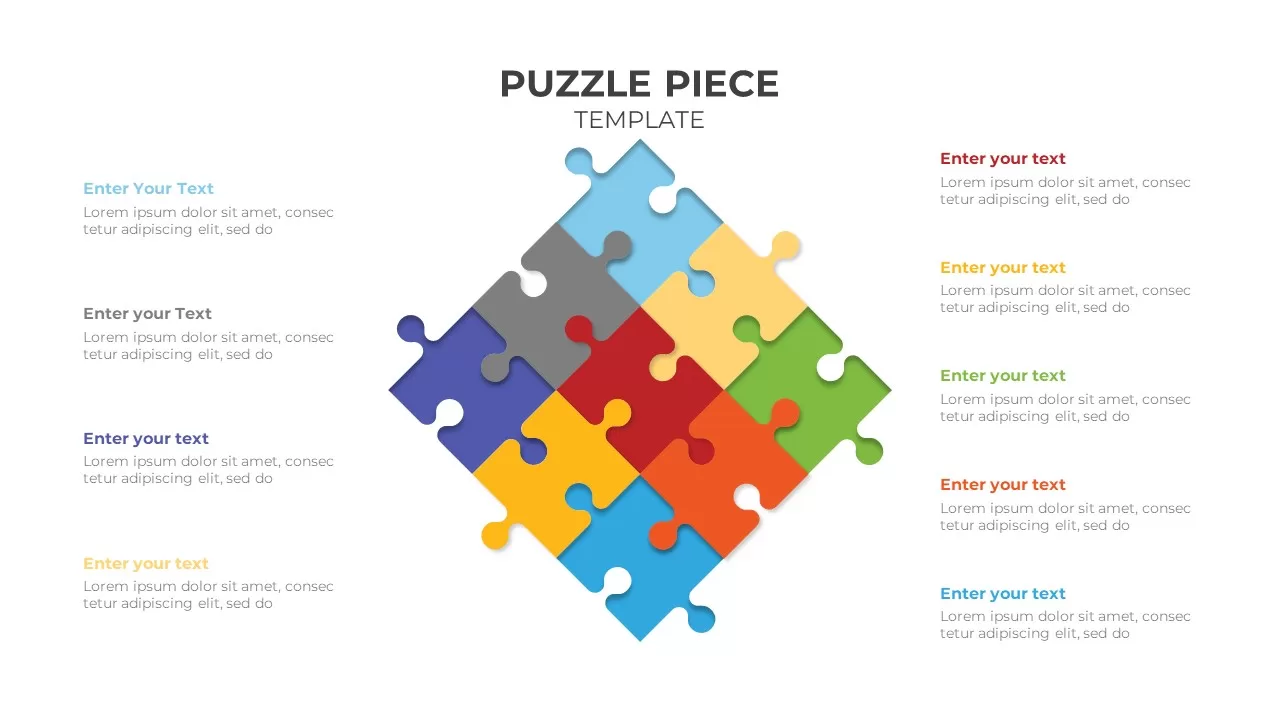
Transform complex frameworks into engaging visuals with this vibrant nine-piece puzzle diagram slide. Nine interlocking jigsaw shapes—rendered in bold hues of sky blue, steel gray, royal purple, crimson red, mustard yellow, bright orange, lime green, and turquoise—form a balanced diamond with an arrowhead at the top, symbolizing focused direction. Each piece features a matching callout on the slide’s margins, pairing a color-accented headline with a concise text placeholder for clear labeling. Subtle drop shadows and beveled edges add depth without clutter, while the clean white background keeps the focus on your content.
Built on fully editable master slides for both PowerPoint and Google Slides, every component can be customized in seconds. Swap piece colors to match your brand palette, adjust the puzzle’s orientation, replace callout text, or embed icons within shapes to reinforce your message. Lockable layers and built-in alignment guides preserve layout integrity during collaborative editing, preventing misalignment when multiple contributors update content. Leverage optional sequential animations to reveal each puzzle piece one by one, guiding audiences through step-by-step processes with visual emphasis.
Optimized for high-resolution displays and virtual presentations, this slide maintains pixel-perfect clarity across devices, eliminating version-control headaches. Whether you’re illustrating system architectures, strategic modules, or multi-department workflows, this nine-piece puzzle template accelerates slide creation, enhances comprehension, and elevates your storytelling.
Who is it for
Project managers, consultants, and team leads will find this nine-piece puzzle diagram indispensable for mapping interdependent workstreams, strategic frameworks, or product ecosystems. Marketing strategists, trainers, and executive presenters can leverage its clear segmentation to communicate workshop agendas, curriculum modules, or partnership networks.
Other Uses
Beyond process mapping, repurpose this slide to showcase balanced scorecards, customer journey touchpoints, organizational structures, or risk assessment matrices. Adjust colors and callouts to highlight KPI clusters, stakeholder roles, or feature comparisons for a versatile visual framework across any business function.
Login to download this file
Add to favorites
Add to collection

Item ID
SB02516