


Map Of World PowerPoint Dark
Description
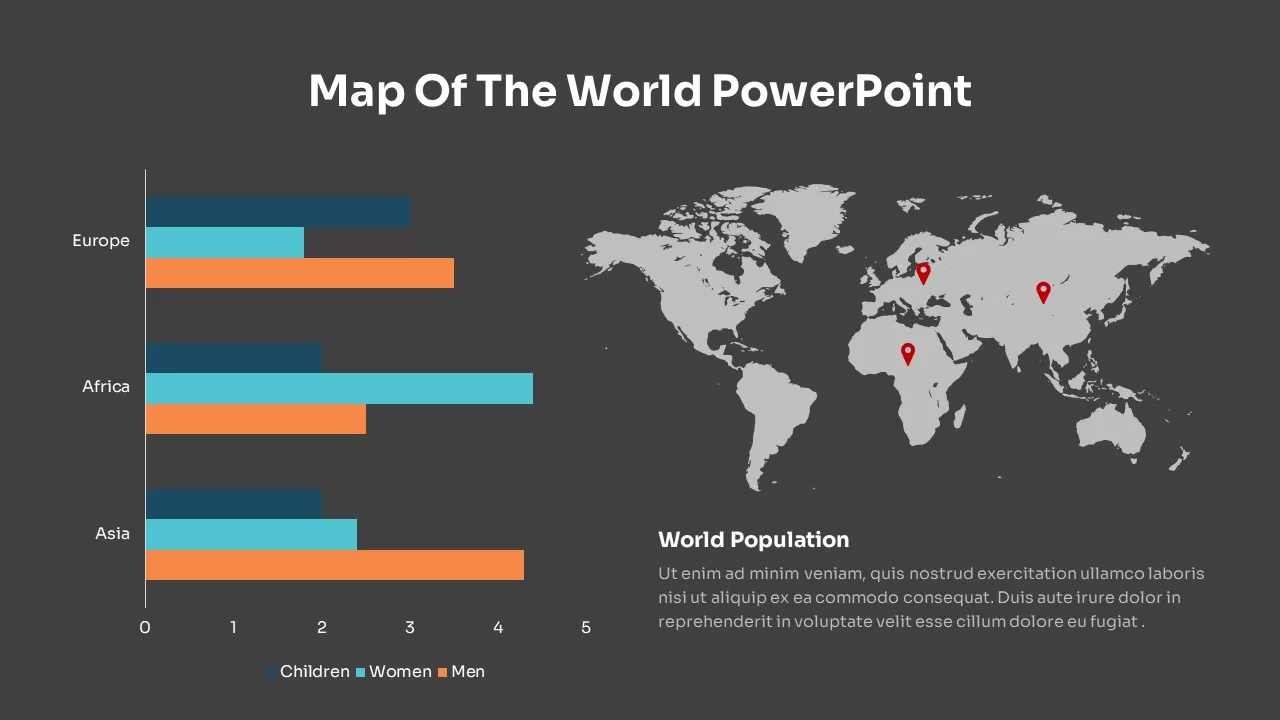
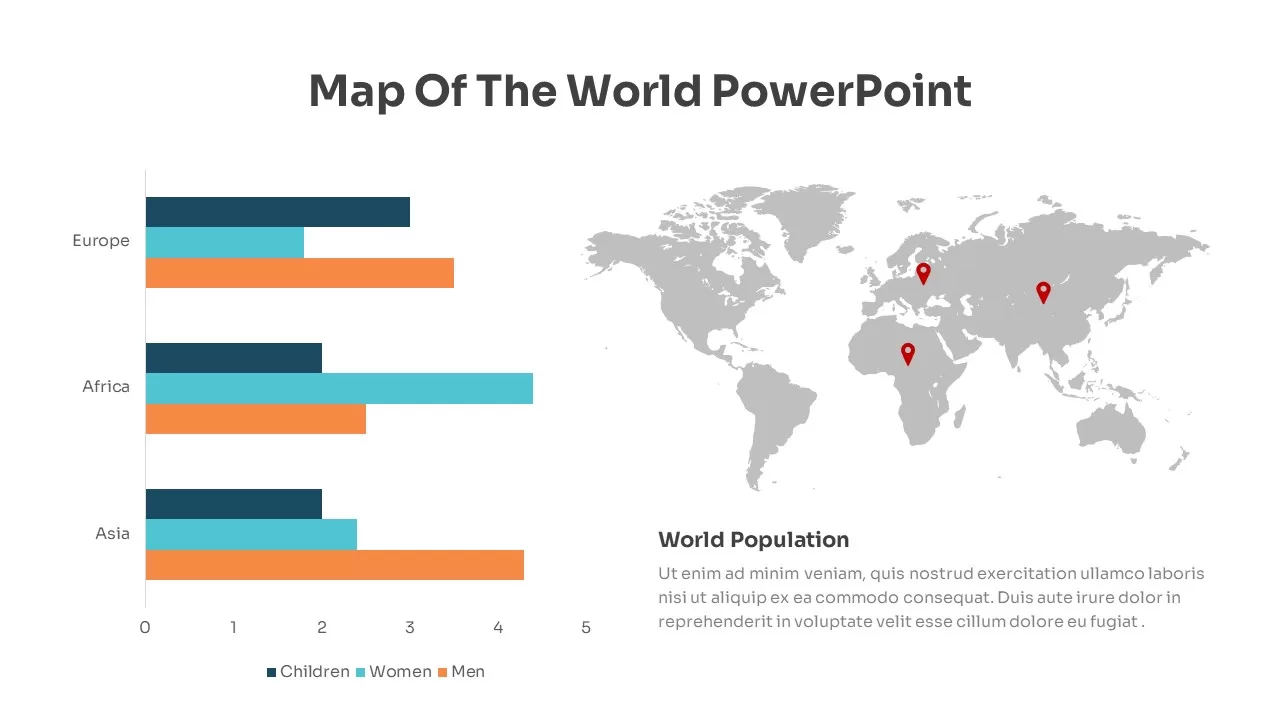
Visualize global population breakdowns with this dual infographic slide combining a bar chart and a world map. The left side features horizontal bars for Children, Women, and Men across key regions—Europe, Africa, and Asia—using distinct teal, cyan, and orange fills. On the right, a grayscale world map highlights three regional callouts with red pins and an editable “World Population” text block below for context.
Built on master slides for both PowerPoint and Google Slides, every element is vector-based for seamless resizing, recoloring, and text updates. Swap out regional labels, adjust chart data, or relocate map pins without disrupting the layout. The light-theme default employs clean typography and subtle drop shadows, while an included dark-theme variant ensures high contrast in any setting.
Ideal for market-entry analyses, demographic presentations, and executive briefings, this template accelerates your storytelling. Duplicate the slide to compare multiple datasets, overlay additional callouts for emerging markets, or integrate into broader strategy decks. With intuitive placeholders and drag-and-drop elements, you can focus on insights rather than formatting.
Who is it for
Business analysts, market researchers, and strategy consultants will leverage this slide to present population metrics by region. Marketing directors, development planners, and executive teams benefit from clear, data-driven geographic visuals.
Other Uses
Beyond population data, repurpose the layout for sales-territory performance, regional revenue comparisons, or epidemiological trend mapping. Adjust bar labels and pin locations to suit any global dataset.
Login to download this file

Item ID
SB02485