


World Map For Power Point Dark

Description
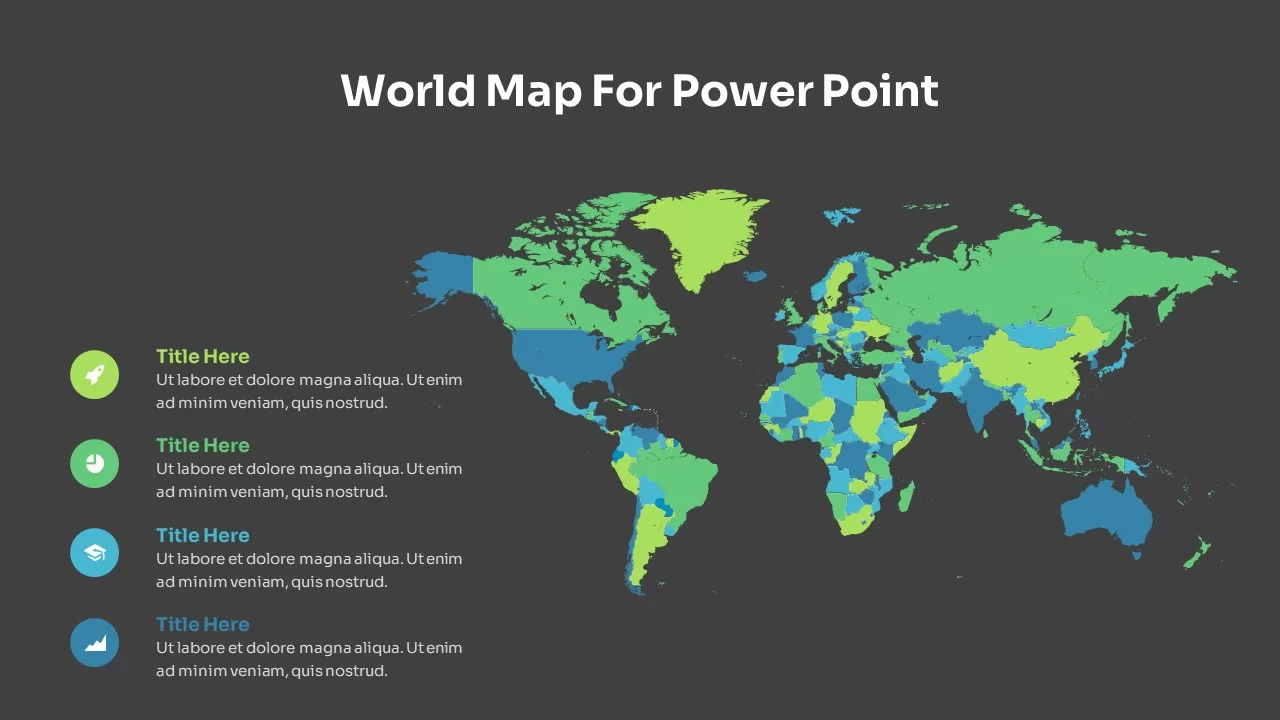
Present global data insights with this fully editable world map infographic template, designed to highlight regional differences, market presence, and strategic focus areas on a single slide. The centerpiece is a high-resolution vector map of all countries, each color-coded in five distinct shades of green and blue to illustrate categories, performance tiers, or demographic segments. Alongside the map, a vertical legend panel features four icon-anchored bullet points with matching color swatches—each space ready for a concise title and descriptive text.
Because every element is built on master slides for both PowerPoint and Google Slides, you can customize the map fill colors, swap out icons, and edit text fields in seconds without disturbing the overall layout. The vector-based design ensures crisp rendering at any zoom level, while subtle drop shadows and rounded-edge containers lend a modern, polished aesthetic. Light- and dark-theme variants are included to maintain legibility in diverse lighting conditions and corporate branding schemes.
Ideal for sales territory overviews, market-entry assessments, global expansion roadmaps, or demographic presentations, this map infographic accelerates your storytelling. Simply recolor countries to reflect performance scores, overlay callouts to spotlight key regions, or adjust the legend items to match your data categories. Duplicate the slide to compare year-over-year shifts, cluster segments by region, or integrate into executive summaries and investor briefings.
With intuitive placeholders and drag-and-drop functionality, you eliminate formatting headaches and ensure consistency across your deck. Whether you’re showcasing international sales growth, mapping supply-chain footprints, or illustrating geographic risk factors, this world map infographic template empowers you to deliver compelling, data-driven narratives in PowerPoint & Google Slides.
Who is it for
Marketing managers, business analysts, and strategy consultants will leverage this template to visualize geographic performance and growth opportunities. Sales directors, market researchers, and corporate strategists benefit from its clear regional breakdowns.
Other Uses
Beyond market analysis, repurpose this slide for educational overviews, NGO impact mapping, epidemiological tracking, or global event planning. Adjust color scales to represent environmental metrics, customer satisfaction levels, or resource allocations.
Login to download this file

Item ID
SB02472