


30 60 90 Days Plan PowerPoint Template Dark

Description
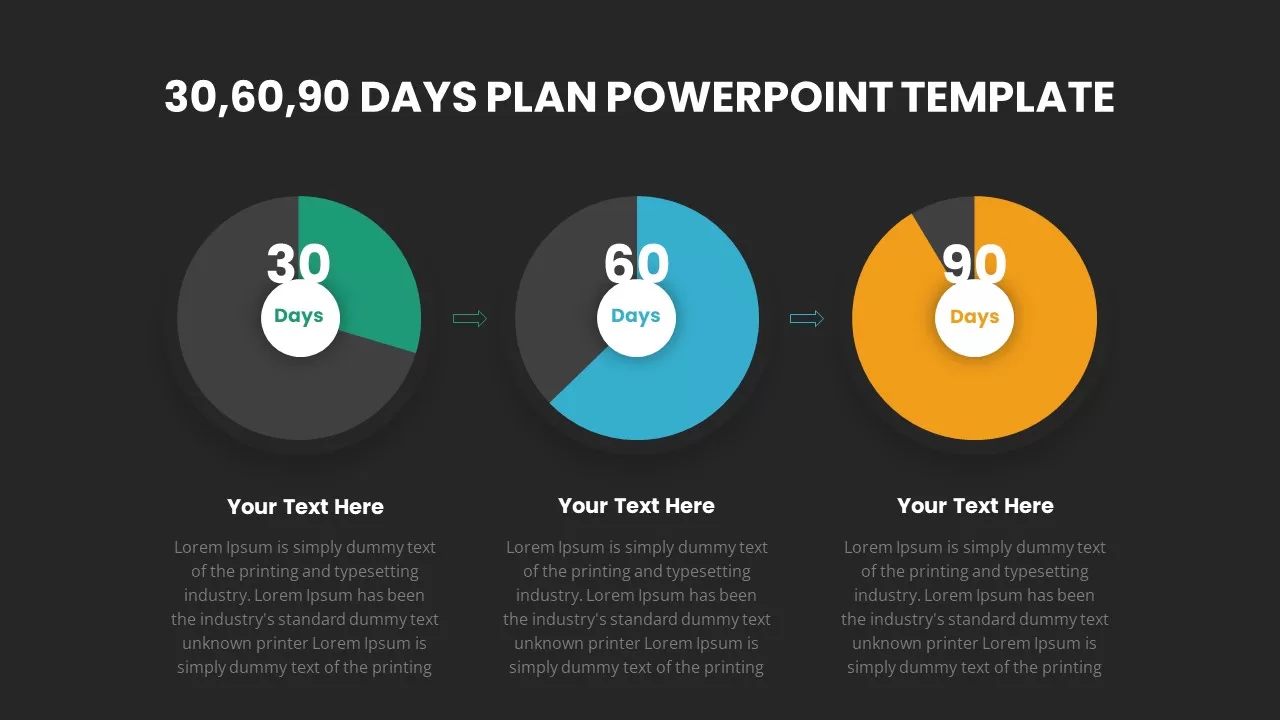
Present your staged business roadmap with this engaging 30-60-90 day donut chart plan infographic. Three circular charts—green for days 1–30, teal for days 31–60, and orange for days 61–90—feature bold colored segments against dark gray fill and crisp white borders. Each chart includes a central day count label and adjacent text area for your objectives, key actions, or success metrics. The balanced layout, subtle drop shadows, and ample white space ensure your milestones stand out without clutter.
Fully editable in PowerPoint and Google Slides, every element is vector-based for seamless resizing and recoloring. Master slide integration guarantees consistent typography and styling across your deck. Simply replace placeholder text, adjust segment colors to match your brand palette, or swap the chart order in seconds. This template streamlines slide creation, letting you focus on crafting clear, measurable goals instead of wrestling with design.
Ideal for onboarding plans, performance reviews, or project kickoffs, the donut chart format delivers intuitive, visually appealing progress tracking. High-resolution graphics render crisply in virtual presentations, printed handouts, and interactive workshops. Download now to transform your first 90 days into a concise, professional infographic that drives stakeholder alignment and accountability.
Who is it for
Project managers, team leads, HR professionals, consultants, and new hires who need to communicate structured 30-60-90 day objectives with impact.
Other Uses
Adapt this slide for quarterly roadmaps, marketing campaign phases, product launch timelines, training schedules, or any phased plan requiring clear visual progress indicators.
Login to download this file

Item ID
SB02431