


people stage infographic templates
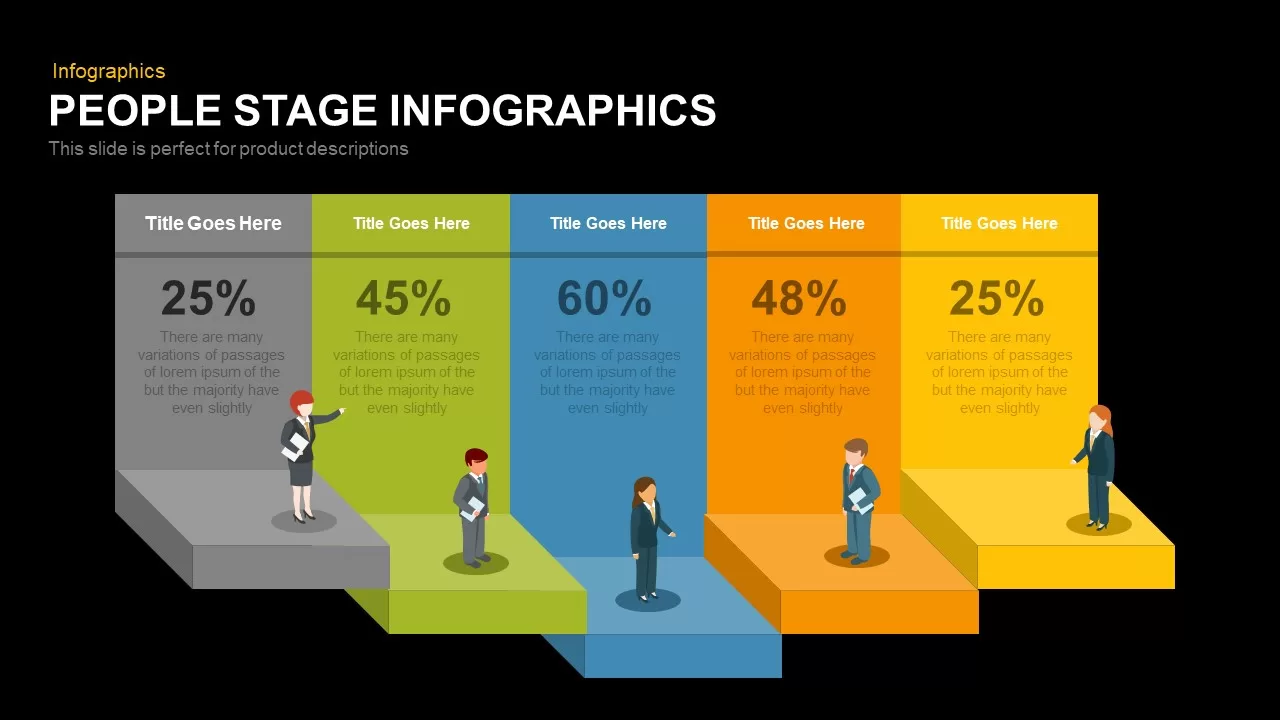

Empower your presentations with this versatile five-stage people infographic chart, designed to illustrate product descriptions, process milestones, or audience segmentation with clarity and visual appeal. The slide features five vertical panels—each rendered in a distinct color (grey, green, blue, orange, and yellow)—that rise from 3D platform bases. Each panel includes a headline placeholder, a bold percentage metric, and supporting text, accompanied by professional people icons positioned on stage-like platforms. The modern flat design leverages crisp typography, subtle drop shadows, and master slide layouts to ensure consistency and ease of editing. Whether you’re showcasing market share, conversion rates, or sequential product features, this infographic delivers structured storytelling and engages your audience from the first glance.
Fully editable in PowerPoint and Google Slides, this template allows you to customize colors, text, fonts, and iconography in seconds. Swap out built-in people illustrations for your own graphics, adjust percentage values, or rename each stage to suit your message. The intuitive placeholder system saves time on formatting and prevents version-control issues, making it ideal for fast-paced team briefings, client pitches, and executive updates. Compatibility across devices ensures your slide retains perfect resolution and layout regardless of platform.
Its balanced five-column arrangement and clear visual hierarchy guide viewers through complex information effortlessly. Use the infographic to represent customer journey touchpoints, product release phases, talent pipeline statistics, or any scenario where a stepwise breakdown and individual personas enhance comprehension. The vector-based design also scales smoothly for print collateral, reports, or digital assets, extending its utility beyond slide decks. With this chart in your toolkit, you can present data-driven narratives with professionalism and impact.
Who is it for
Product managers, marketing and sales leaders, and UX designers can leverage this five-stage people infographic to communicate product features, conversion funnels, or customer journeys with clarity and visual impact. Consultants, project managers, and HR professionals will also benefit when presenting segmented audience data, process milestones, or performance metrics in a cohesive, step-by-step format.
Other Uses
Beyond product descriptions, repurpose the infographic for customer journey mapping, sales pipeline breakdowns, employee onboarding steps, or talent acquisition processes. Adjust titles and percentages to reflect budget forecasts, milestone tracking, or team performance dashboards, making this template a versatile addition to any business presentation.
Login to download this file

Item ID
SB00374