


blue ocean infographic template
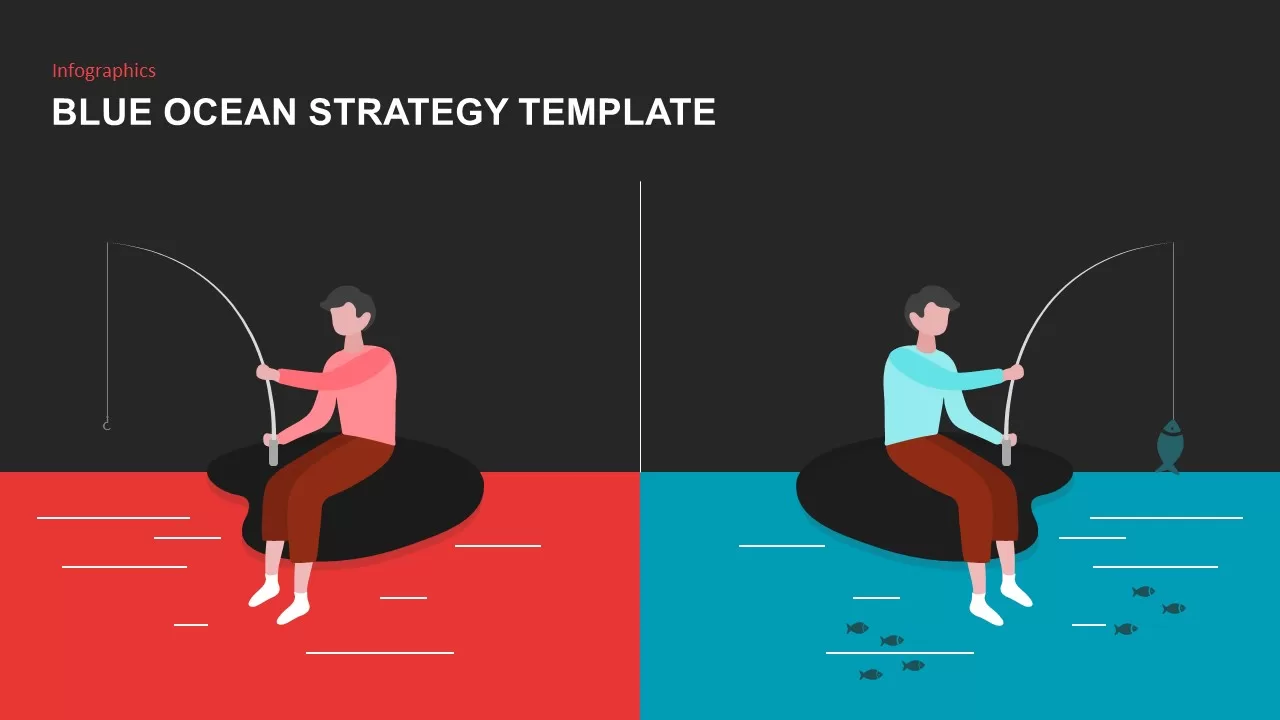
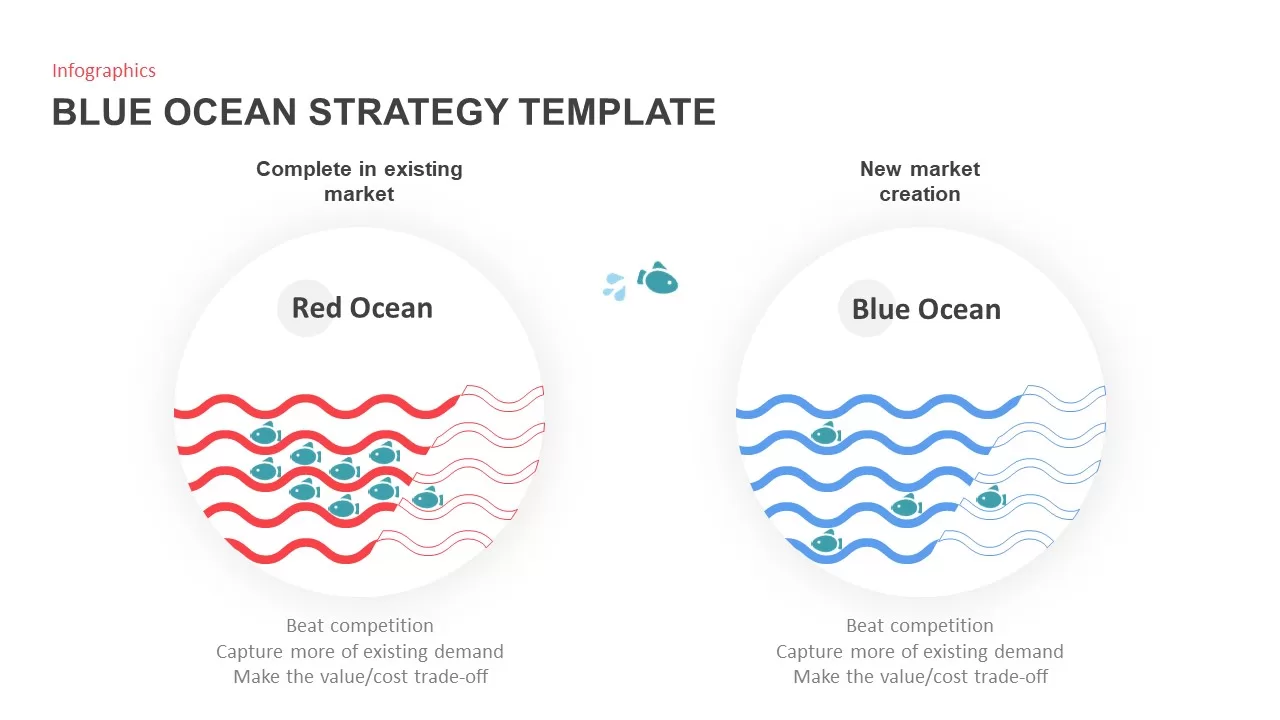
Leverage this Blue Ocean Strategy infographic template to compare red-ocean competitiveness with blue-ocean innovation in a clear, data-driven layout. The slide opens with two circular diagrams: a red circle dense with fish icons to illustrate market saturation and a blue circle with fewer fish to represent uncontested space. Subsequent slides include a side-by-side illustration of a fisherman in red versus blue waters, a VS comparison chart of strategic actions, and an X-shaped “Value Innovation” framework. Each element uses bold red and blue accents against a clean white background, vector-based graphics, and minimalist typography to emphasize your key messages without clutter.
Built on editable master slides in both PowerPoint and Google Slides, this template lets you customize color schemes, swap icons, adjust text, and hide unused elements with ease. Simply replace sample text with your strategic insights, adjust the value-cost trade-off labels, or insert your own illustrations. The consistent use of flat design, subtle drop shadows, and balanced white space ensures professional polish across all screen sizes and print formats.
Who is it for
Strategy consultants, business analysts, product managers, and marketing teams will benefit from this template when presenting competitive analyses, strategic workshops, or executive briefings on market innovation.
Other Uses
Repurpose these layouts for risk-reward comparisons, competitive landscape mappings, go-to-market planning, or any framework that contrasts two strategic approaches.
Login to download this file

Item ID
SB02002