


cube shape template
Description
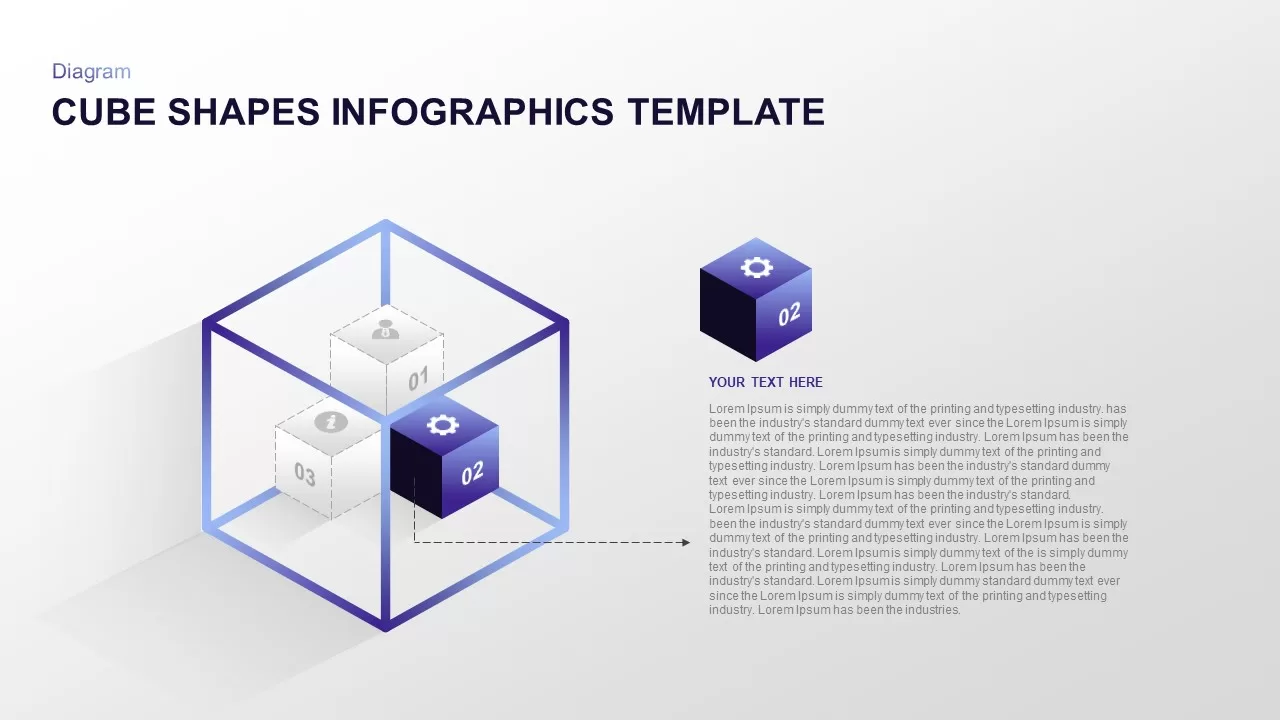
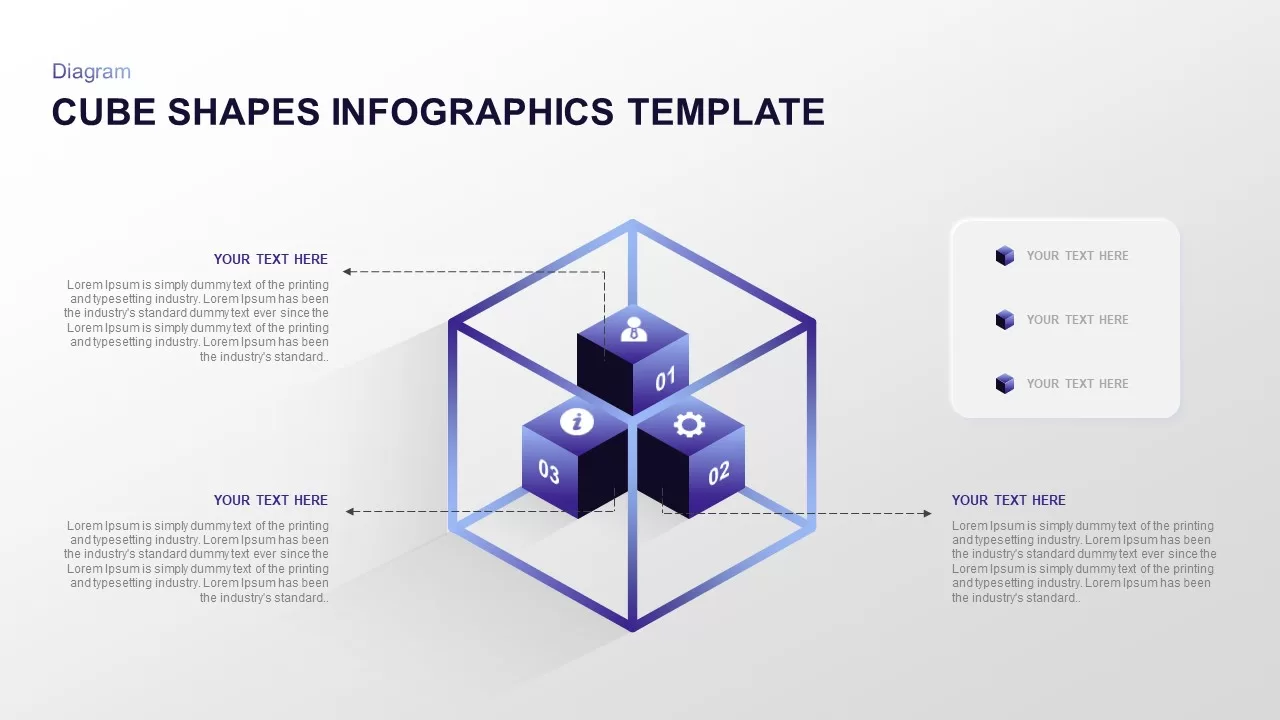
Unveil complex ideas with this isometric 3D cube infographic slide, designed to present modular themes, component relationships, or segmented data within a transparent cube framework. The main graphic features a large wireframe cube with three colored internal cubes, each representing a distinct module or data point. Each internal cube is numbered and color-coded—purple, cyan, and white—supported by sleek icon placeholders and brief text areas to the side. The generous whitespace and minimal typography balance the dimensional effect, ensuring readability and audience engagement.
Engineered for PowerPoint and Google Slides, this slide leverages master layouts and theme controls to let you adjust cube sizes, swap colors, and toggle between light and dark backgrounds effortlessly. Replace placeholder icons with your custom visuals, relabel text fields, and reconfigure cube positions to map processes such as product components, service tiers, or sequential phases. The entire graphic is built from editable vector shapes, allowing infinite scalability without quality loss. Layered elements enable you to separate, animate, or focus on individual cubes during presentations to guide audience attention.
Beyond product or process depictions, this infographic serves as a versatile visual for organizational charts, risk matrix breakdowns, or concept frameworks. Duplicate the cube structure across multiple slides to illustrate comparisons, parallel workflows, or hierarchical relationships. Use the side text modules to highlight features, benefits, or action items, and employ subtle entrance animations to reveal each cube in turn. Whether you’re delivering a corporate pitch, academic lecture, or marketing proposal, this isometric cube slide enhances storytelling by turning abstract concepts into clear, memorable visuals.
Who is it for
Business strategists, product managers, and marketing professionals will benefit from this slide when explaining component-based offerings, service tiers, or segmented data. Educators, consultants, and project leads can also use it to visualize frameworks, process breakdowns, or comparative analyses.
Other Uses
Repurpose this cube infographic to showcase feature comparisons, risk assessments, or departmental structures. Adapt internal cubes to represent milestone markers, performance metrics, or resource allocations. Apply the wireframe container to visualize containment hierarchies, ecosystem models, or layered architectures.
Login to download this file

Item ID
SB01969