


Gauge Shape 5 Step Infographic 9
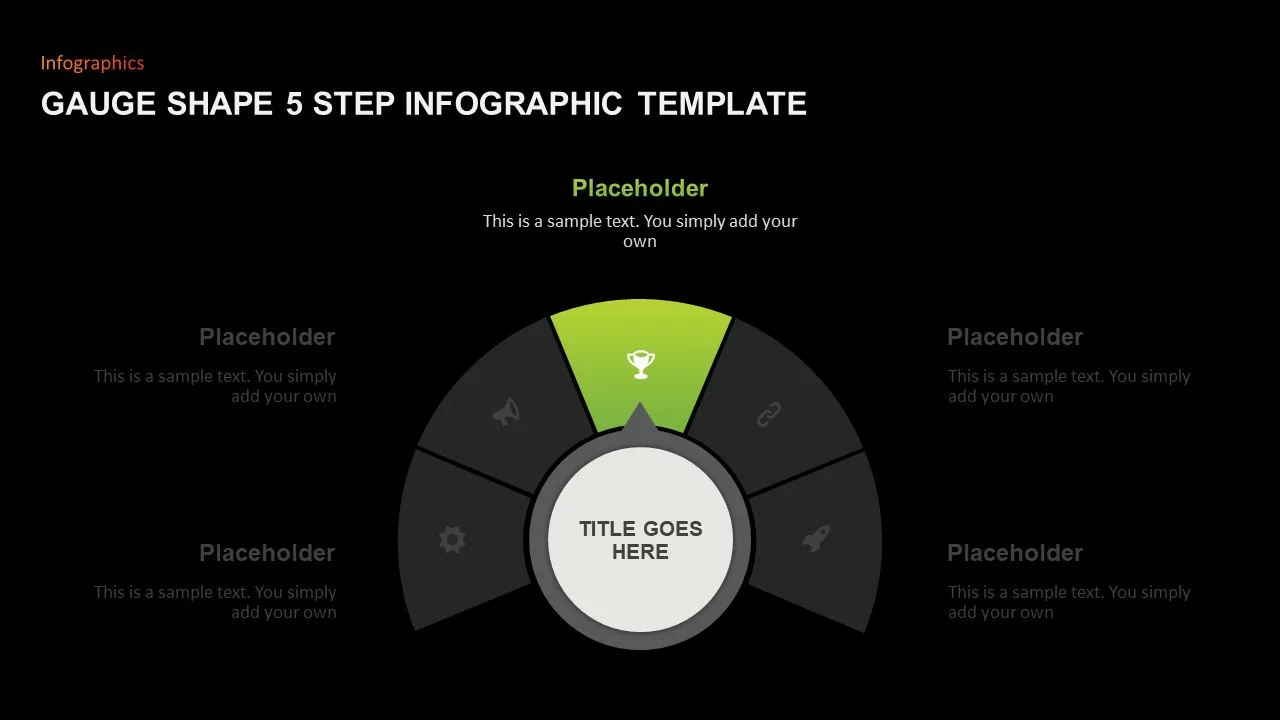
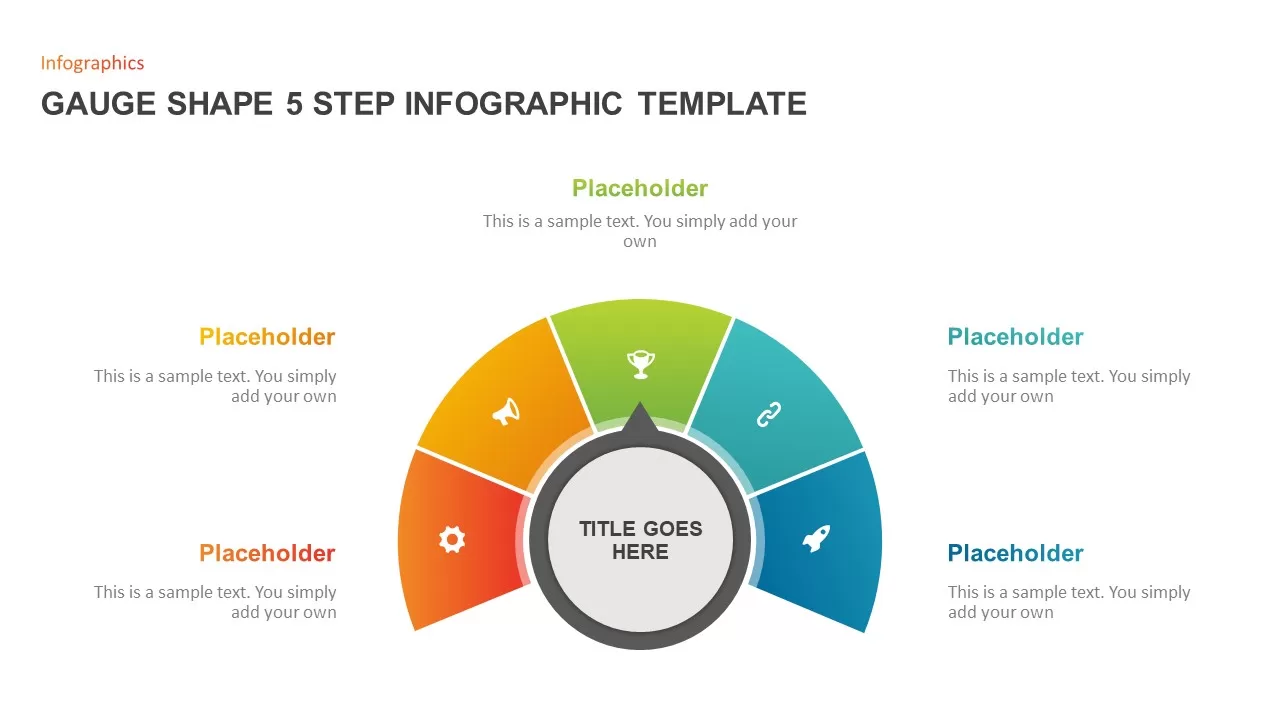
Harness the power of a semicircular gauge infographic with five color-coded segments to present sequential steps, progress metrics, or performance benchmarks in a visually compelling layout. The central circle offers an editable title placeholder while each outer slice features a custom icon placeholder—gear, megaphone, trophy, link, rocket—aligned above a bold label and supporting caption. Segments progress from warm red and orange hues on the left through yellow-green to cool teal and blue on the right, guiding viewer attention across your narrative flow.
Built on versatile master slides, this fully editable template enables users to swap icons, adjust segment colors, or resize shapes to match corporate branding or project themes. Each gauge segment is separated by crisp white dividers and enhanced by subtle drop shadows that create depth without overwhelming the clean white background. Preconfigured sequential-reveal animations allow you to introduce each step one at a time, perfect for guiding audiences through process workflows, marketing funnels, or KPI dashboards.
Optimized for both PowerPoint and Google Slides, the slide maintains its alignment and clarity across devices, eliminating formatting issues during collaboration. The uncluttered design supports text labels of varying lengths, ensuring legibility in boardroom presentations, training workshops, or client pitches. Whether illustrating five-phase roadmaps, operational processes, or performance targets, this gauge infographic streamlines complex data into an intuitive visual framework.
This infographic also includes placeholder legends and detailed callout boxes for adding percentage values, trend indicators, or milestone dates alongside each gauge segment. High-resolution vector shapes ensure sharp visuals on large screens and printed handouts, while adjustable color gradients provide visual continuity. The design’s symmetry and balanced proportions draw the eye naturally from left to right, facilitating clear storytelling and strategic insights.
Who is it for
Project managers, marketing professionals, and data analysts can leverage this five-step gauge infographic to showcase process phases, campaign milestones, or performance KPIs. Consultants, trainers, and educators will find the sequential-reveal feature invaluable for interactive presentations and workshop facilitation.
Other Uses
Repurpose the gauge layout for progress tracking, sales pipelines, resource allocation reviews, or timeline overviews. Customize icons and labels to visualize product launch stages, customer-journey touchpoints, training modules, risk-assessment steps, or executive summaries, making this graphic a versatile asset across business functions and academic projects.
Login to download this file

Item ID
SB01765