


Manpower Planning Concept for PowerPoint 1
Description
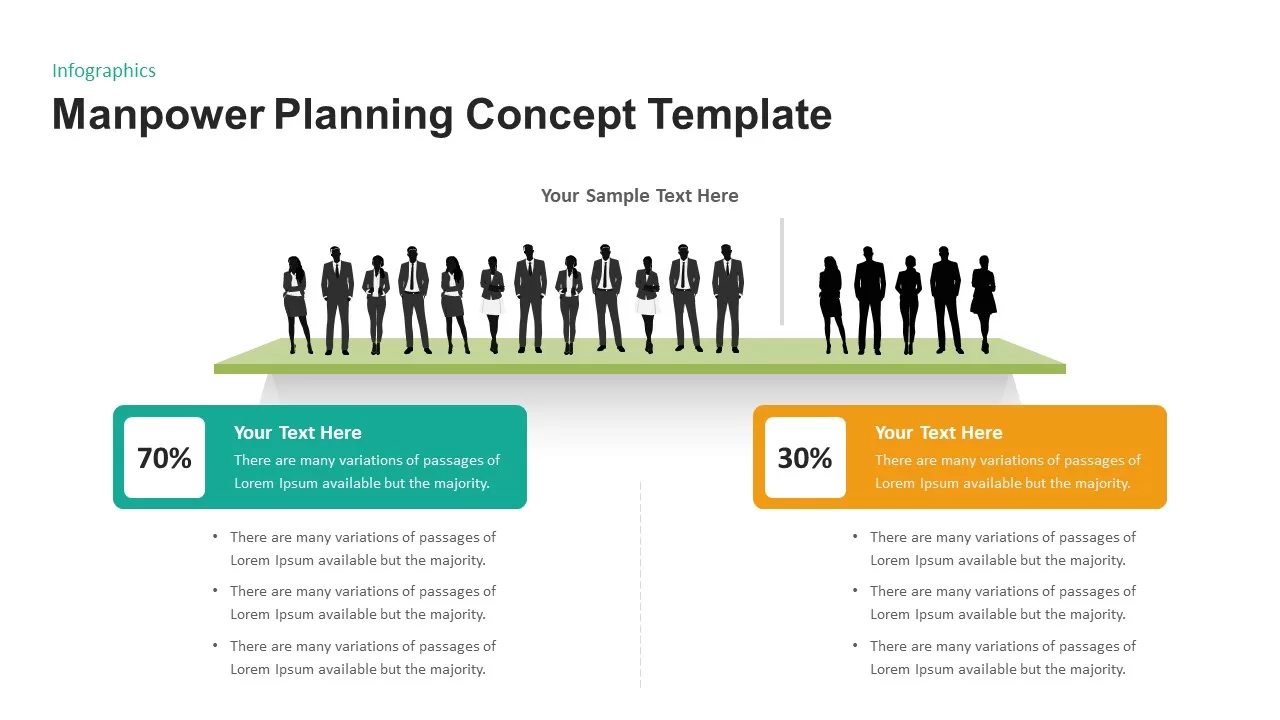
This manpower planning infographic compares workforce segments side by side, using a raised platform graphic populated with silhouette figures and a clear divider to distinguish two groups. Large percentage callouts (e.g., 70% vs. 30%) sit inside bold color blocks—teal for one cohort and amber for the other—paired with editable text boxes for key insights. Below each block, bullet-list placeholders let you expand on factors such as skills gaps, shift allocations, or team demographics. Built on master slides, every element is fully customizable: swap silhouettes for department icons, adjust percentages, relabel text fields, or apply your brand’s color palette with drag-and-drop ease. Snap-to-grid alignment and grouped vector layers ensure that resizing or moving components never disrupts the layout.
Optimized for both PowerPoint and Google Slides, this template preserves crisp, high-resolution graphics across devices and supports seamless cloud collaboration. Use the central text header to introduce your planning context—such as “Current vs. Target Staffing”—and duplicate the slide to compare multiple scenarios or timeframes. The minimalist white background and precise drop shadows ensure readability in boardrooms, virtual meetings, or printed handouts, while the balanced use of accent colors directs audience focus to the most critical data points.
Whether you’re presenting headcount analyses, budget allocations, or recruitment forecasts, this layout turns complex workforce data into an accessible visual narrative. Leverage pre-grouped layers and editable legends to swap out percentage blocks for charts or icons, and maintain brand consistency with global theme settings. This versatile slide accelerates strategic discussions, supports data-driven decision-making, and helps stakeholders quickly grasp staffing priorities.
Who is it for
HR leaders, workforce planners, operations managers, and consultants who need to compare staffing levels, skill distributions, or budget-to-headcount ratios in clear, side-by-side visuals.
Other Uses
Repurpose this comparison format for budget vs. spend breakdowns, project resource allocations, customer segmentation splits, or risk-impact assessments by updating labels, percentages, and iconography.
Login to download this file
Add to favorites
Add to collection

Item ID
SB01819