


6 Output Process PowerPoint Template 6
Description
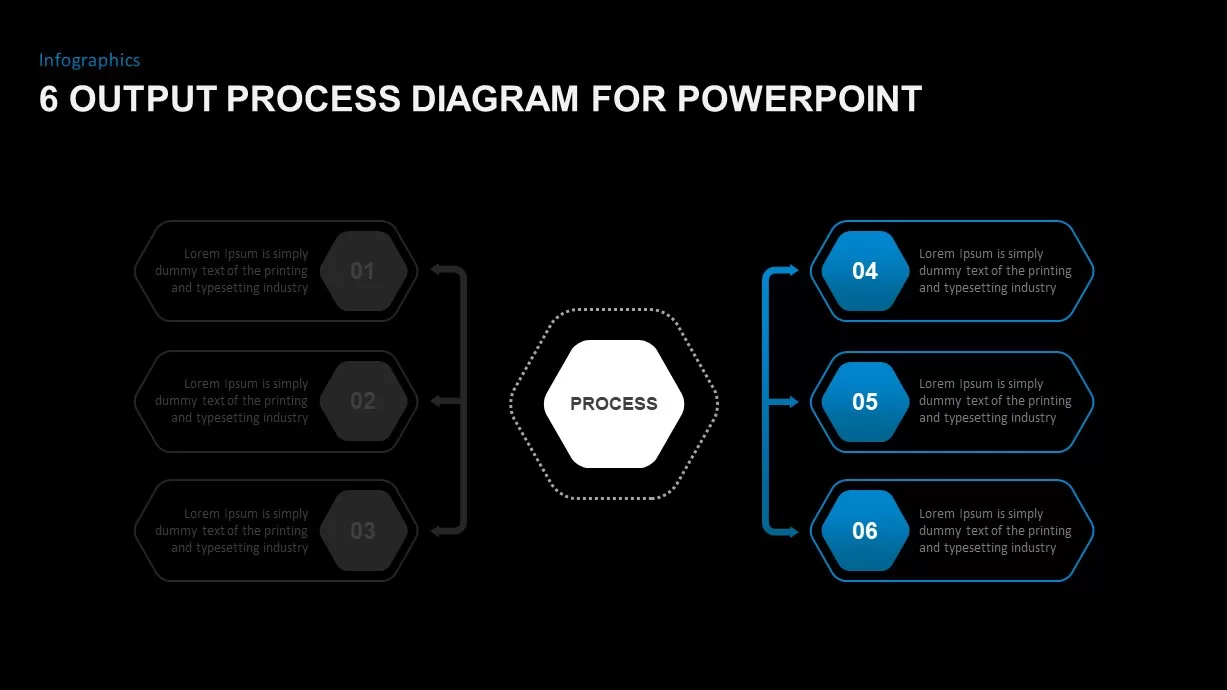
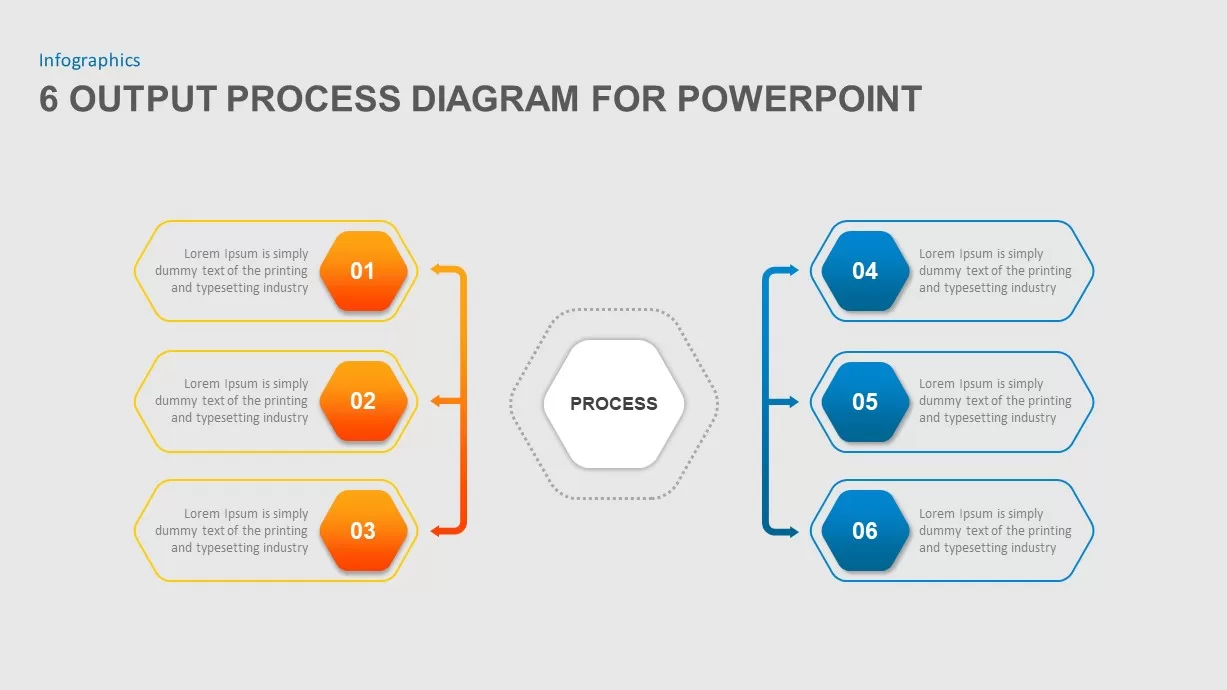
Leverage this six-step output process diagram slide to present complex workflows and data flows with clarity and dynamic visual appeal. At its core, a central hexagon shape labeled “Process” anchors the design, with three orange-gradient connectors on the left and three blue-gradient connectors on the right converging toward the center. Each connector ends in a numbered hexagonal placeholder (01 through 06), allowing you to highlight sequential stages, inputs, outputs, or parallel streams. The thin gradient arrows emphasize movement and direction, guiding audience attention through the workflow. This slide uses a clean white background, subtle dotted outlines, and crisp typography to maintain a professional aesthetic while drawing focus to the colored accents.
Built with fully editable vector shapes and master slide integration, this template supports rapid customization: adjust the size and position of hexagon nodes, switch gradient hues to align with corporate branding, replace or recolor icons, and tailor text placeholders to your messaging. The intuitive layout streamlines editing, ensuring a consistent visual hierarchy and eliminating manual alignment tasks. A structured grid and guideline system underlies the design, enforcing pixel-perfect placement and uniform spacing across elements.
Optimized for both PowerPoint and Google Slides, this asset delivers full-resolution clarity and seamless cross-platform compatibility. Use it to map product lifecycle stages, illustrate supply chain inputs and outputs, or detail customer journey touchpoints. Expand or contract the number of steps by duplicating connector groups, or repurpose individual nodes to emphasize parallel processes or branching scenarios. The symmetrical left-right arrangement fosters logical flow and balanced composition, enhancing comprehension and retention.
Ideal for executive briefings, stakeholder workshops, and operational reviews, this six-step diagram elevates your presentation by combining intuitive data visualization with professional design. Leverage the vibrant gradients to draw attention to critical stages, and apply subtle animations to the connectors for added dynamism.
Who is it for
Project managers, operations teams, and business analysts will benefit from this slide when illustrating complex workflows, process outputs, and data flows. Supply chain managers, product teams, and marketing strategists can leverage the clear segmentation to map inputs, outputs, and sequential stages.
Other Uses
Beyond standard process mapping, repurpose this slide to outline project roadmaps, customer journey stages, or compliance workflows. Use the hexagon nodes to emphasize risk checkpoints, KPI reporting streams, or stakeholder approval stages. Duplicate connectors to accommodate additional subprocesses or cross-functional handoffs.
Login to download this file
Add to favorites
Add to collection

Item ID
SB01748