


Hot Air Balloon PowerPoint Timeline Template 8
Description
Leverage this vibrant Hot Air Balloon infographic template to transform data into engaging visual stories using fully editable PowerPoint and Google Slides layouts. The kit includes four distinct slide designs:
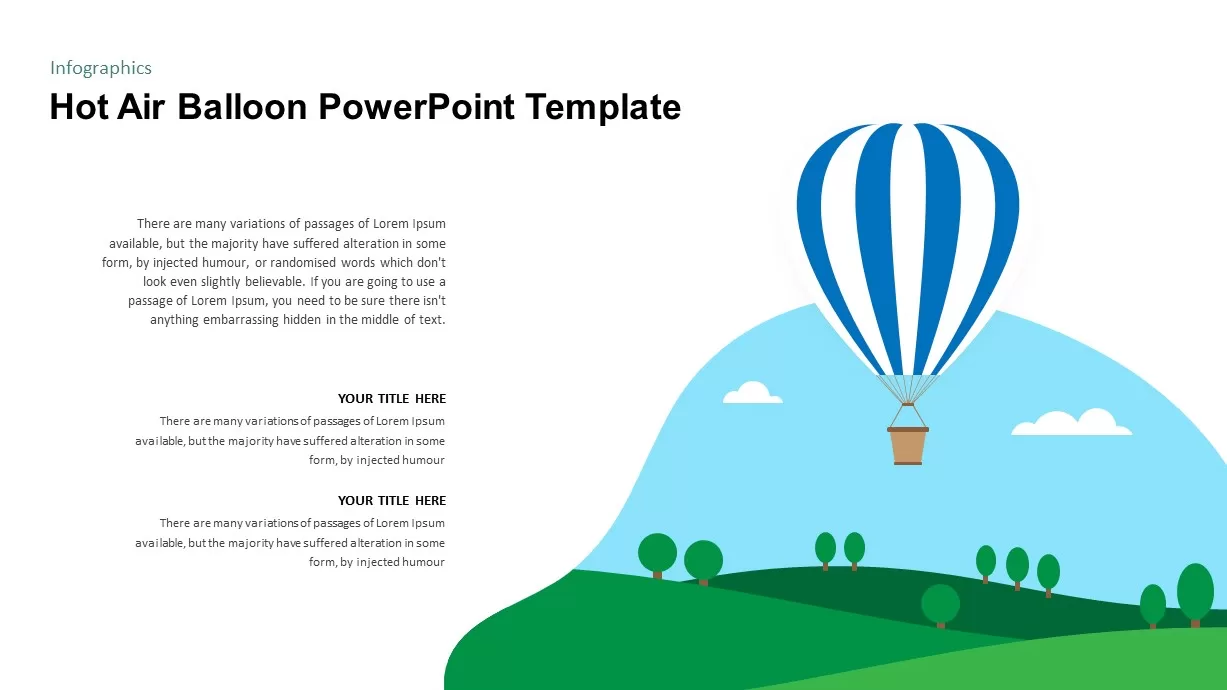
Hero Layout: A full-screen hot air balloon soaring over layered hills with two headline and body text zones—perfect for introducing themes or highlighting key statistics.
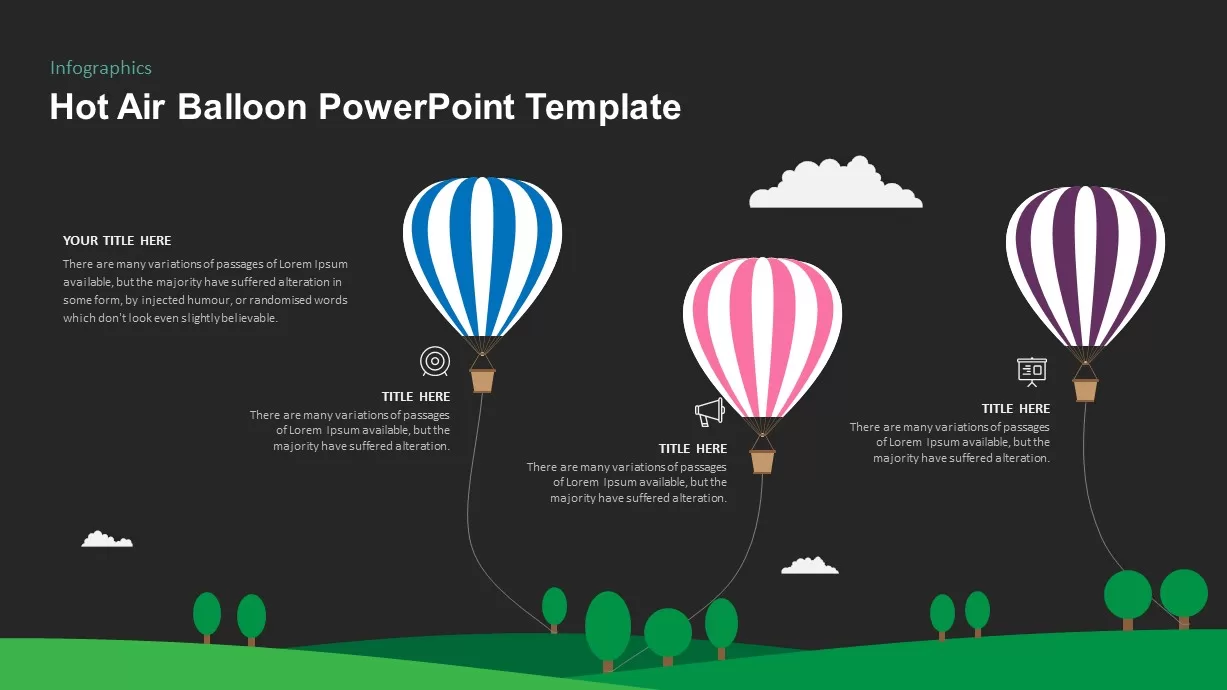
Comparison Slide: Three tethered balloons floating against a bright sky, each with icon markers and caption areas—ideal for side-by-side feature, product, or team comparisons.
Icon Callouts: A central, oversized balloon surrounded by six circular icons linked via fine lines to customizable text blocks—excellent for detailing processes, benefits, or service components.
Timeline Progression: Five sequential balloons connected by a gentle curve, each containing year labels and text fields—ready for mapping project milestones, growth phases, or roadmap steps.
Every element is vector-based, grouped for easy ungrouping, and bound to master slides for consistent spacing, fonts, and color themes. Swap icons from the built-in library, adjust balloon sizes, or recolor shapes in seconds via the theme palette. Cloud and hill background layers can be toggled or recolored to match branding guidelines. Comprehensive slide-specific notes guide you through best practices in infographic storytelling, layout adjustments, and typography tweaks. Whether you’re presenting market comparisons, project roadmaps, feature breakdowns, or milestone timelines, this balloon-themed toolkit accelerates design time and delivers a polished, modern aesthetic that resonates across educational, corporate, and creative contexts.
Who is it for
Marketing teams, educators, and project managers will benefit from these infographic slides to explain concepts, compare options, and track progress. Start-up founders, product strategists, and operations leaders can use the layouts to visualize roadmaps, feature sets, and performance metrics.
Other Uses
Repurpose these balloon graphics for onboarding presentations, process overviews, event agendas, team introductions, departmental reports, or goal-setting workshops. Use the comparison slide to evaluate vendors, the icon layout for service breakdowns, or the timeline design for historical overviews and strategic planning.
Login to download this file

Item ID
SB01716