


SQERT project management model presentation template 6
Description
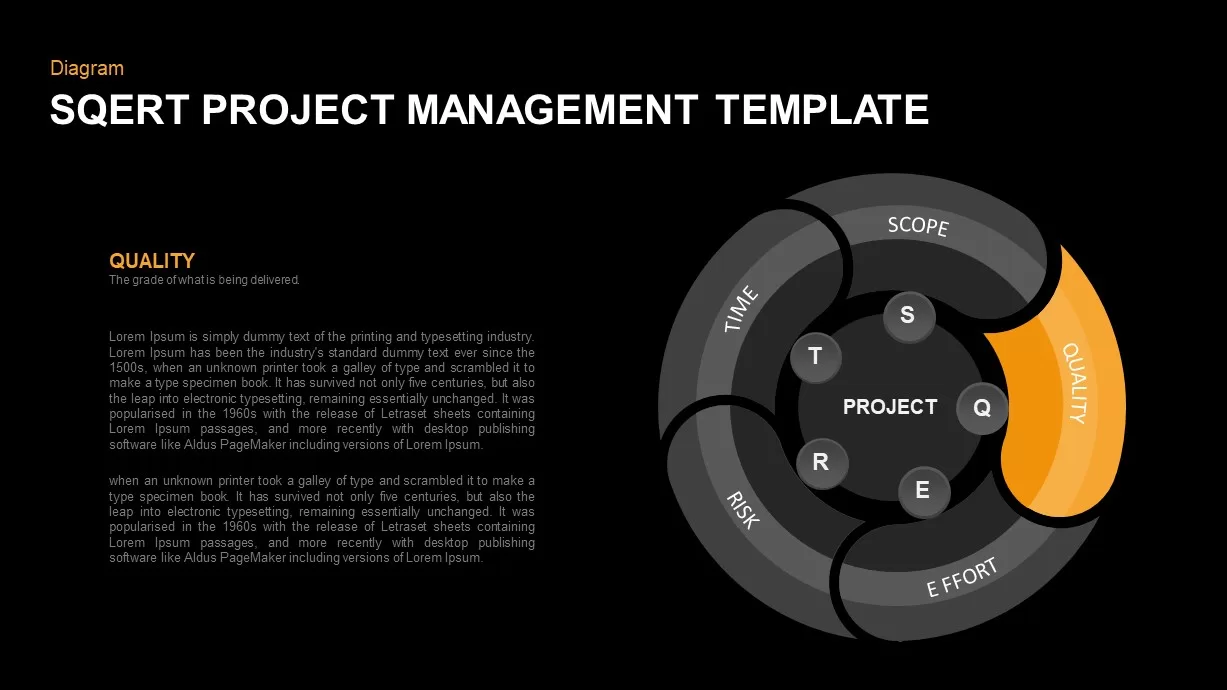
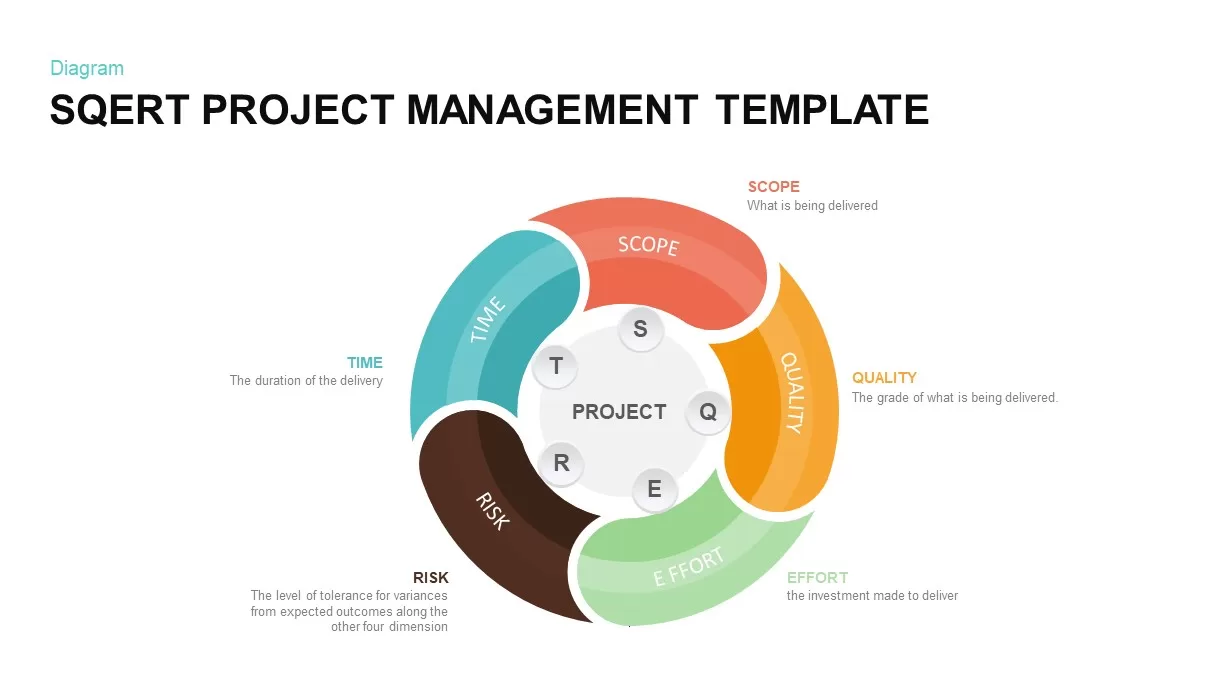
This six-slide infographic pack visualizes the SQERT project management model—Scope, Quality, Effort, Risk and Time—around a central “Project” hub. The overview slide presents five interlocking, gradient-filled arcs that form a continuous ring, each labeled with the SQERT dimension and connected to the project core. Subsequent slides spotlight each dimension in turn, fading the other four to light gray while highlighting the selected arc in vibrant color. Each detail slide pairs a bold heading and brief definition on the left with the corresponding colored arc enlarged on the right, allowing clear, focused discussion of scope boundaries, quality standards, resource investments, tolerance for risk or delivery timelines.
Built on editable master slides with vector shapes, this template lets you adjust arc colors, relabel dimensions, swap icons or insert custom data in seconds—all without breaking alignment or resolution. Rounded corners, subtle drop shadows and smooth gradient transitions reinforce a modern, professional aesthetic. Both light-background and dark-mode variants are included, ensuring readability and consistency across devices and presentation environments. Use the animation placeholders to step through each dimension sequentially or reveal the full cycle at once for executive overviews.
Whether you’re mapping project charters, defining performance trade-offs or training teams on balanced project controls, this SQERT infographic streamlines storytelling. Duplicate or hide slides to tailor the deck, add your own notes beside each arc or integrate metrics alongside definitions. Its modular design also supports expansion into related frameworks—simply insert additional arcs or swap labels to represent extended dimensions like Cost or Stakeholder Engagement.
Who is it for
Project managers, PMO leaders, program directors and portfolio managers will leverage these infographics to explain multi-dimensional trade-offs, set stakeholder expectations and align cross-functional teams. PMO analysts, process consultants and executive sponsors can also use the pack to drive structured discussions and document governance standards.
Other Uses
Beyond project management, repurpose this cyclical diagram for continuous improvement models, balanced scorecards or strategic frameworks that require highlighting individual components—such as SWOT, risk registers or resource allocation cycles.
Login to download this file

Item ID
SB01702