


Cube Core Diagram Ppt Template
Description
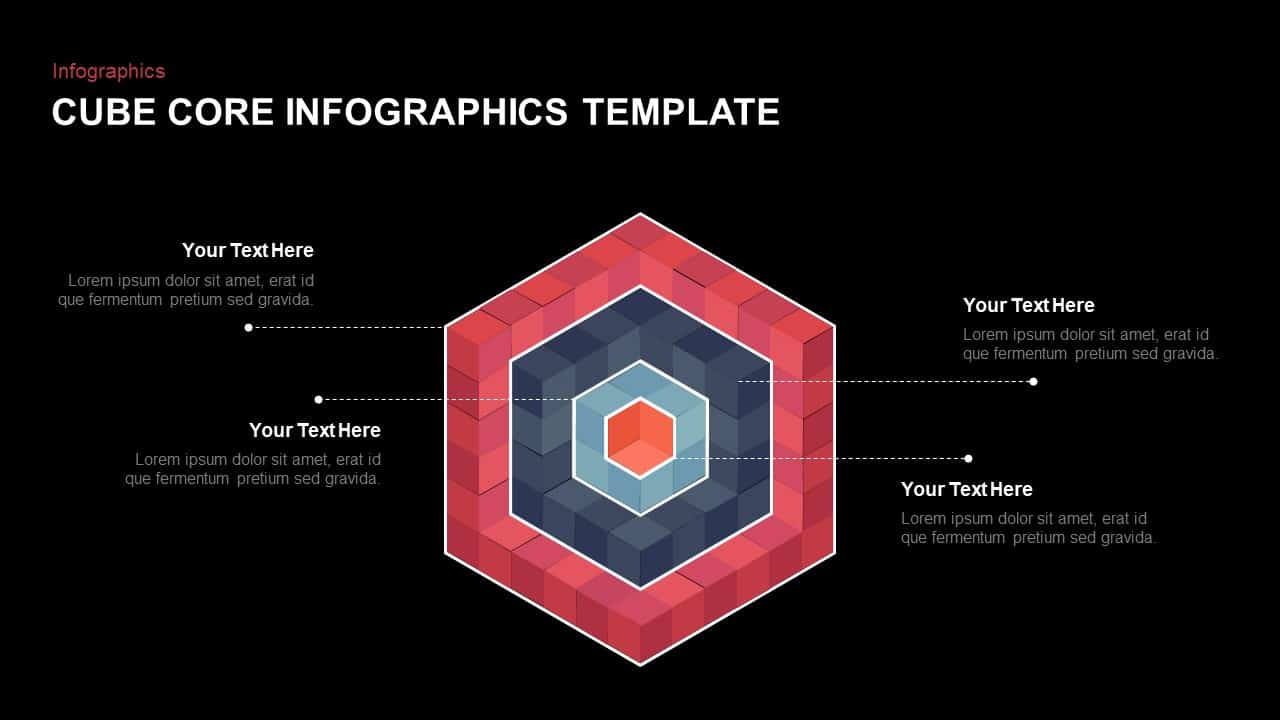
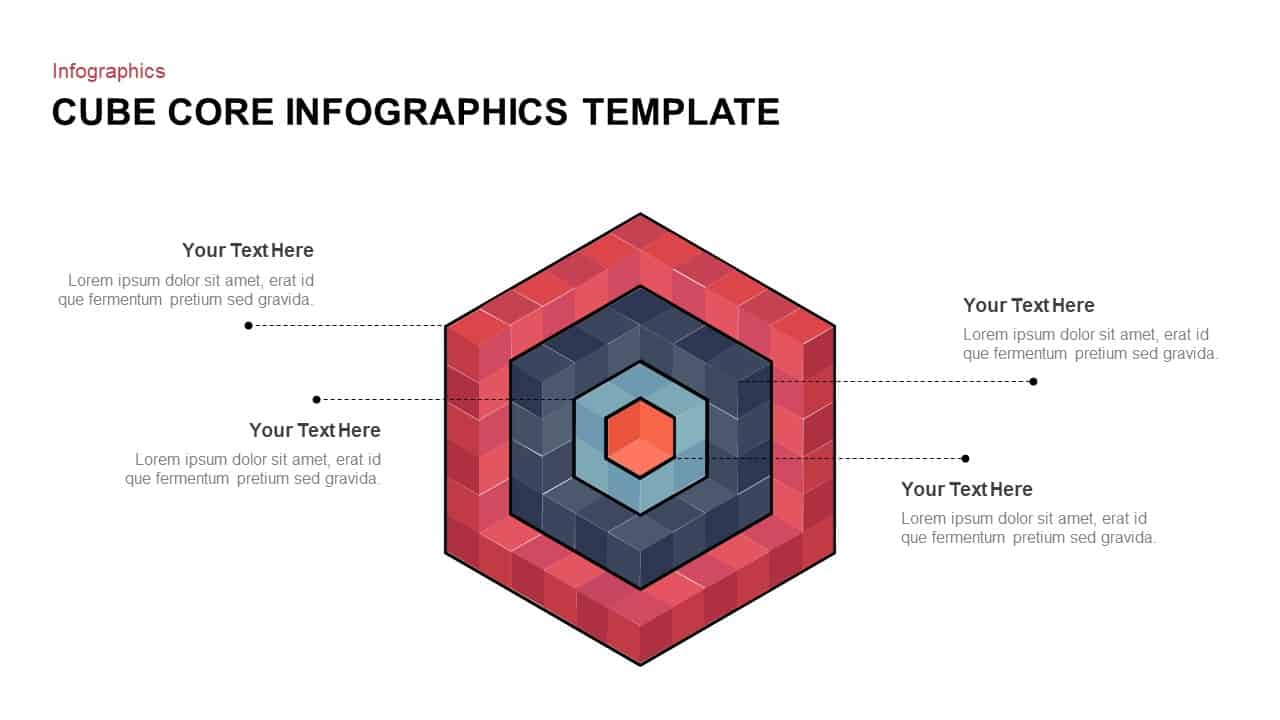
Showcase intricate concepts and multi-layered processes with the Cube Core Infographics Template. This visually engaging slide highlights a 3D hexagonal structure, where each level of the cube can be filled with unique text, making it ideal for organizing ideas, showcasing data hierarchies, or displaying a process with multiple stages. The template’s clean, modern design, combined with bold color contrasts like red, blue, and orange, ensures your audience’s focus stays on key insights.
The slide is fully customizable, offering placeholders for your text and graphics. The sleek, geometric layout lends itself to complex presentations, allowing you to present detailed concepts with clarity. Each cube layer provides a clear, structured space for additional information, while the 3D effect adds depth and appeal to your slide. Use this template to create compelling visual narratives for project proposals, reports, or business presentations. It’s optimized for both PowerPoint and Google Slides, ensuring smooth presentation delivery across various platforms.
This template also supports a range of use cases, from illustrating core principles, organizational charts, and workflows to breaking down product features, competitive advantages, or project milestones. By leveraging this design, you can turn abstract ideas into concrete, digestible visuals that enhance communication and engagement with your audience.
Who is it for
This template is ideal for professionals across various industries, including project managers, business analysts, consultants, and educators who need to present multi-step processes or hierarchical data in a visually appealing manner. It can also be useful for marketing teams showcasing product benefits or executive teams presenting strategic plans.
Other Uses
Beyond process illustrations, use this slide for product feature breakdowns, data hierarchy visualizations, competitive analysis, or organizational structure displays. It's also effective in depicting project roadmaps, workflow charts, and performance metrics, making it adaptable to various presentation scenarios.
Login to download this file
Add to favorites
Add to collection

Item ID
SB01581