


8 Step Gear Diagram PowerPoint Template
Description
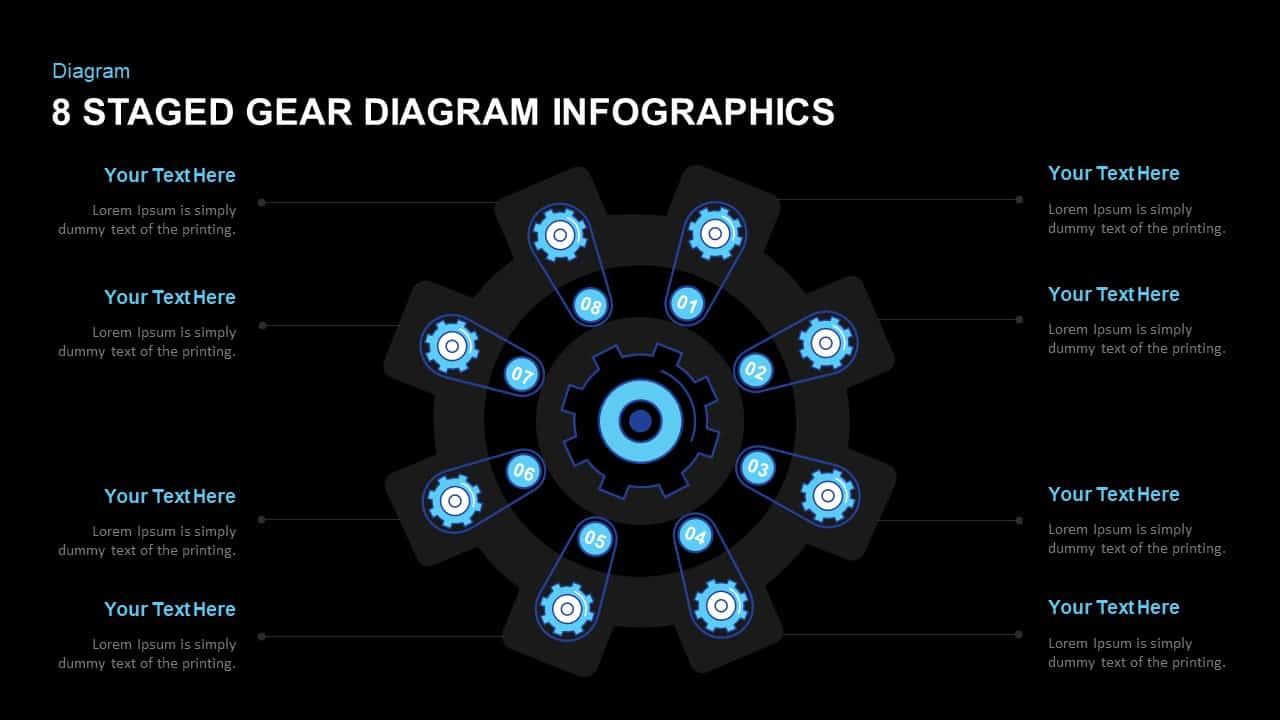
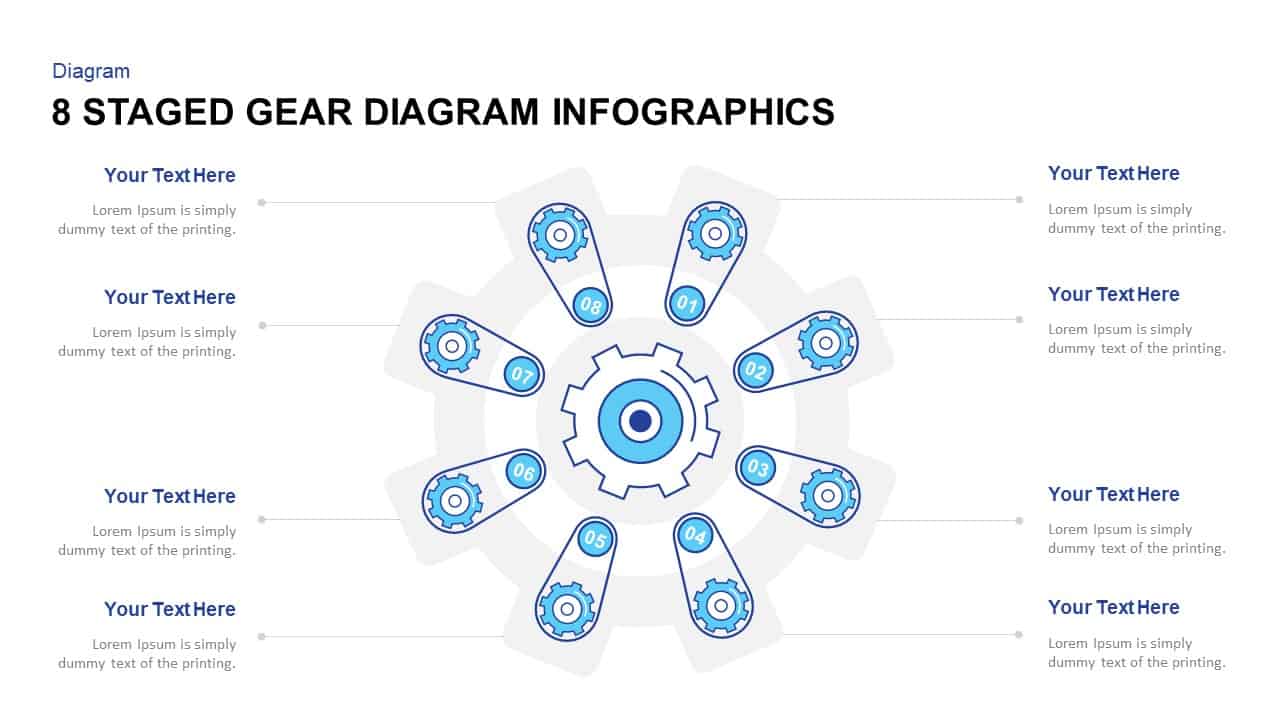
Use this fully editable eight-stage gear diagram to visualize complex workflows, process dependencies, or system components in a cohesive circular layout. The slide features a central gear hub surrounded by eight numbered gear spokes, each rendered in crisp blue gradients and linked to text callouts on alternating sides. Icon placeholders on each spoke let you swap in industry-relevant symbols—such as finance, logistics, analytics, and collaboration—to reinforce stage semantics. Built with vector shapes and master slide layouts in both PowerPoint and Google Slides, you can adjust colors, replace icons, edit labels, or reposition callouts in seconds without misalignment.
Preconfigured entrance animations guide audiences through each gear stage one by one, reinforcing the cyclical nature of iterative processes and maintaining engagement during live presentations. The minimalist white background, subtle drop shadows, and clean sans-serif typography ensure that your content remains the focal point, while the consistent blue-gray palette conveys a professional, modern aesthetic. Cross-platform compatibility eliminates version-control headaches and formatting inconsistencies, enabling seamless collaboration across devices and operating systems.
Ideal for illustrating multi-departmental workflows, product development cycles, or supply-chain mechanisms, this gear infographic empowers presenters to break down intricate systems into digestible segments. Duplicate or hide individual spokes to adapt the diagram for fewer or additional stages, making it equally suited for strategic roadmaps, quality-assurance audits, or risk assessment frameworks. With its blend of visual impact and functional precision, this slide becomes an indispensable tool for driving data-driven discussions and aligning stakeholders on process architecture.
Who is it for
Operations managers, process engineers, and project leads will benefit from this gear diagram when mapping end-to-end workflows, conducting root-cause analyses, or presenting system overviews. Business consultants, strategy teams, and training facilitators can also leverage it to teach iterative methodologies and cross-functional dependencies.
Other Uses
Repurpose this infographic for organizational charts, technology ecosystems, change-management roadmaps, or continuous-improvement cycles. The modular design supports custom iconography and stage labeling to suit any industry or enterprise context.
Login to download this file

Item ID
SB01559