


5 step infographic powerpoint template
Description
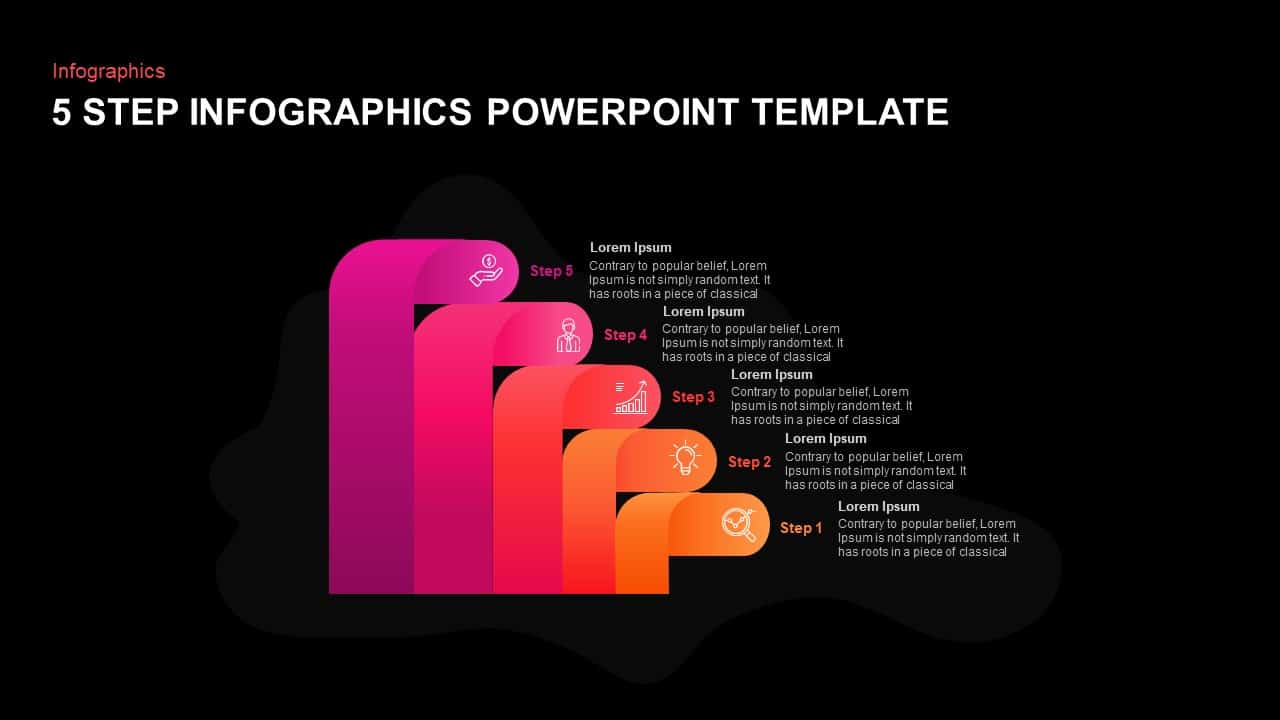
Elevate your presentations with a vibrant 5-step infographic process slide that uses smooth gradient bars and modern icons to illustrate sequential workflows or project phases. The slide features five ascending curved bars tinted from orange through crimson to magenta, each numbered and paired with an icon placeholder for visual cues—magnifying glass, lightbulb, bar chart, user, and hand holding coin. Beside each bar, editable text fields allow for concise descriptions, while a subtle abstract background shape adds depth without distracting from your content.
Designed for maximum flexibility, all elements are fully customizable via master slides: change gradient colors to match your brand, swap icons for industry-specific visuals, or adjust text placeholders to convey detailed insights. The intuitive hierarchy ensures that each step stands out clearly, guiding viewers through complex processes at a glance. Grid-aligned layouts and consistent typography maintain a professional look across devices and screen sizes.
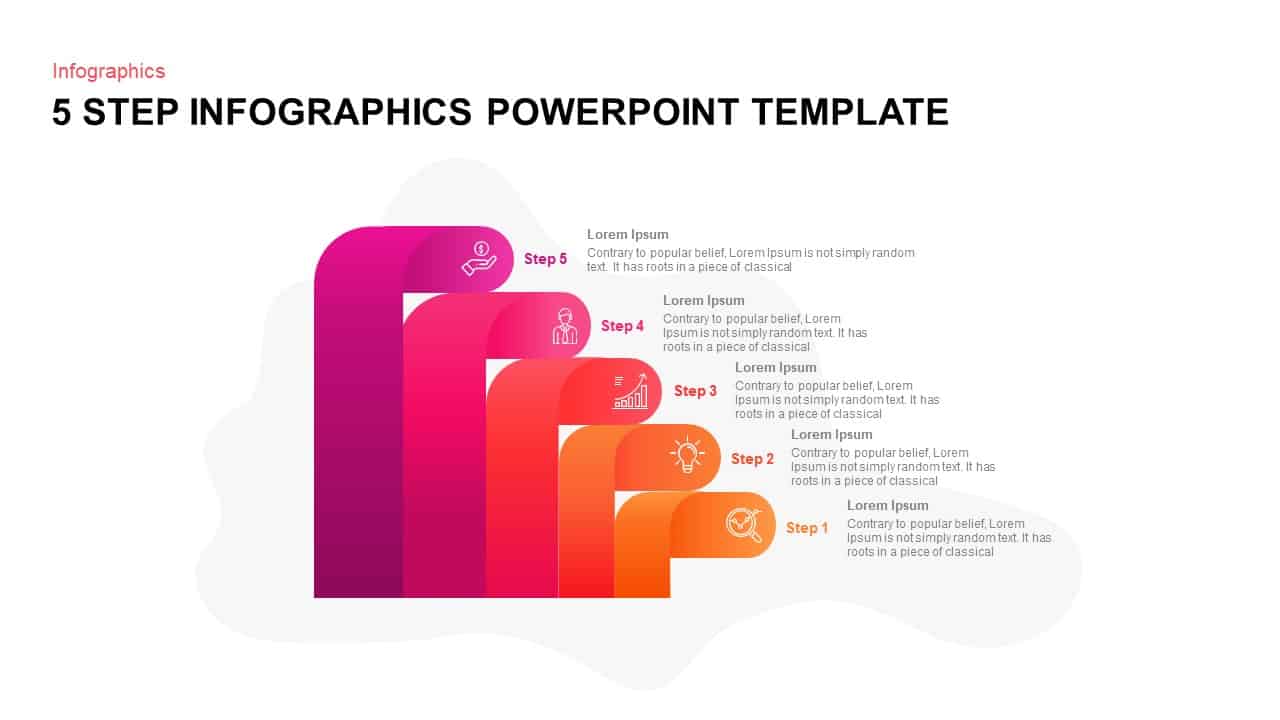
Built on a light neutral background, the design ensures clarity while maintaining a modern minimalist aesthetic. Compatible with both digital and printed formats, export high-resolution PDFs or integrate slides into custom corporate templates. Leverage cloud-based collaboration in Google Slides or share native PPTX files for seamless team workflows and version control.
Whether you’re outlining marketing funnels, product development stages, or operational workflows, this 5-step infographic empowers you to translate sequential data into a compelling narrative. Use it for strategy reviews, quarterly roadmaps, training sessions, or performance dashboards. With pixel-perfect scaling and drag-and-drop simplicity in both PowerPoint and Google Slides, you can integrate this slide seamlessly into any deck, speeding up collaboration and reducing editing headaches.
Download and customize this 5-step infographic process slide to engage stakeholders, clarify step-by-step strategies, and present your workflow with striking visual impact. Simplify complexity, highlight progression, and make every phase of your process unforgettable.
Who is it for
Business analysts, project managers, marketing strategists, and consultants will benefit from this infographic when outlining multi-step processes, workflows, or project milestones. It’s also ideal for trainers, educators, and executives seeking to communicate sequential information clearly and memorably.
Other Uses
Beyond corporate presentations, repurpose this slide for product development roadmaps, change-management plans, onboarding procedures, or quarterly reviews. Adapt the bars to illustrate cause-and-effect chains, decision-making workflows, or timeline overviews across departments and industries.
Login to download this file
Add to favorites
Add to collection

Item ID
SB01460