


Accounting Cycle PowerPoint Presentation
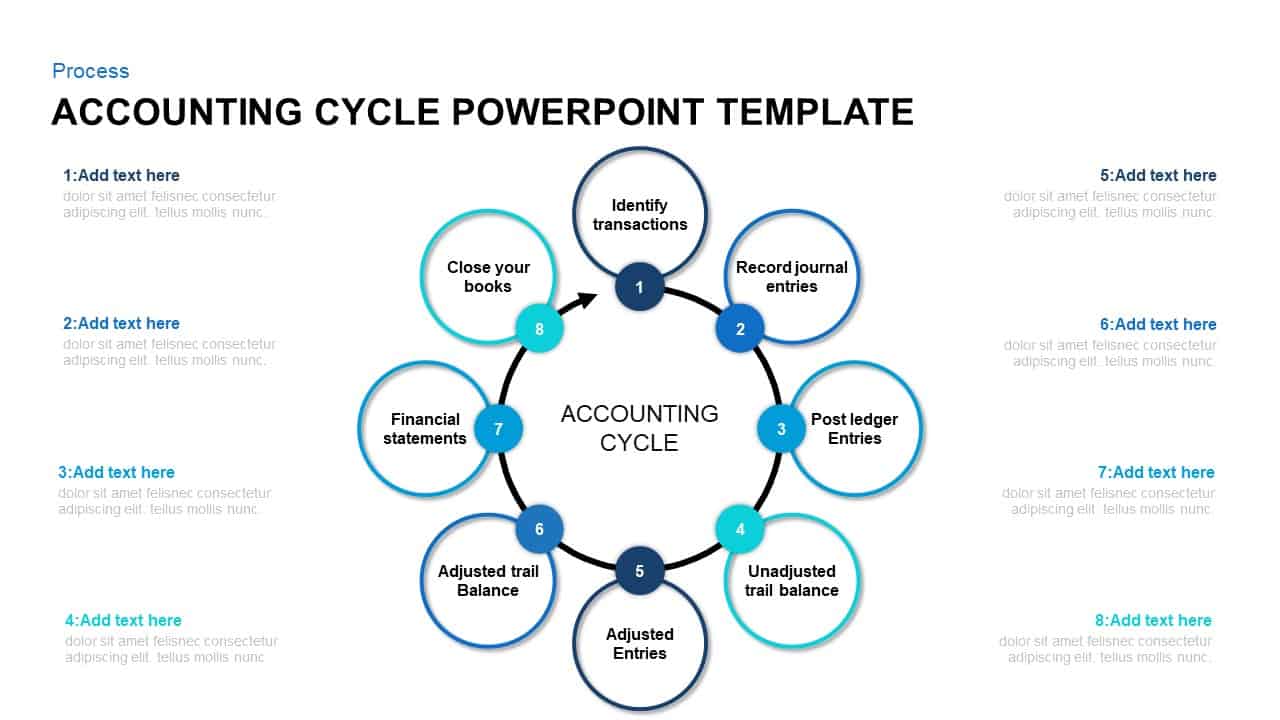
Leverage this detailed 8-step circular accounting cycle slide to visually map core financial processes with precision and clarity. The graphic showcases sequential stages—from transaction identification and journal entries to trial balances, financial statements, and book closures—arranged around a clean circular flow. Each stage features an icon placeholder, bold step number, and text block for concise descriptions and key metrics. Subtle drop shadows and colored outlines distinguish each node, while a minimalist black ring anchors the design on a crisp white backdrop. This layout ensures audiences can quickly grasp complex workflows, making it ideal for boardrooms, client briefings, and virtual presentations.
Fully built on master slides, this template offers seamless customization: swap icons for industry-specific visuals, adjust accent colors to match your brand palette, or modify step labels and descriptions in seconds. Vector-based shapes maintain perfect clarity on any display, from high-resolution monitors to printed handouts. Logical grouping and editable placeholders allow you to reorder steps, add or remove nodes, and reposition text areas without compromising alignment or design integrity. Compatible with both PowerPoint and Google Slides, this asset eliminates formatting headaches and ensures consistent visuals across platforms and devices.
Ideal for finance teams, auditors, and accounting educators, this cycle diagram simplifies communication of recurring processes and audit workflows. Use it to present month-end closures, quarterly reviews, internal audit procedures, or educational modules. Duplicate the slide for multi-cycle comparisons or export individual segments as standalone infographics. With intuitive design and robust functionality, this slide empowers you to convey detailed financial procedures efficiently, engage stakeholders, and support data-driven discussions.
Beyond core accounting functions, repurpose this circular framework to map project governance cycles, compliance checklists, KPI review loops, or performance reporting dashboards. Adjust colors and text to fit any sequential narrative, ensuring professional polish across all your presentations.
Who is it for
Finance managers, auditors, accounting instructors, CFOs, and business analysts will benefit from this diagram when outlining financial workflows, audit cycles, or educational training modules for internal and external stakeholders.
Other Uses
Repurpose this slide to illustrate project review cycles, compliance processes, risk management loops, or KPI tracking frameworks. Modify step titles and icons to suit any recurring process or audit-style presentation.
Login to download this file
Add to favorites
Add to collection

Item ID
SB01440