


Seller Portals Seller Requirement PowerPoint Template
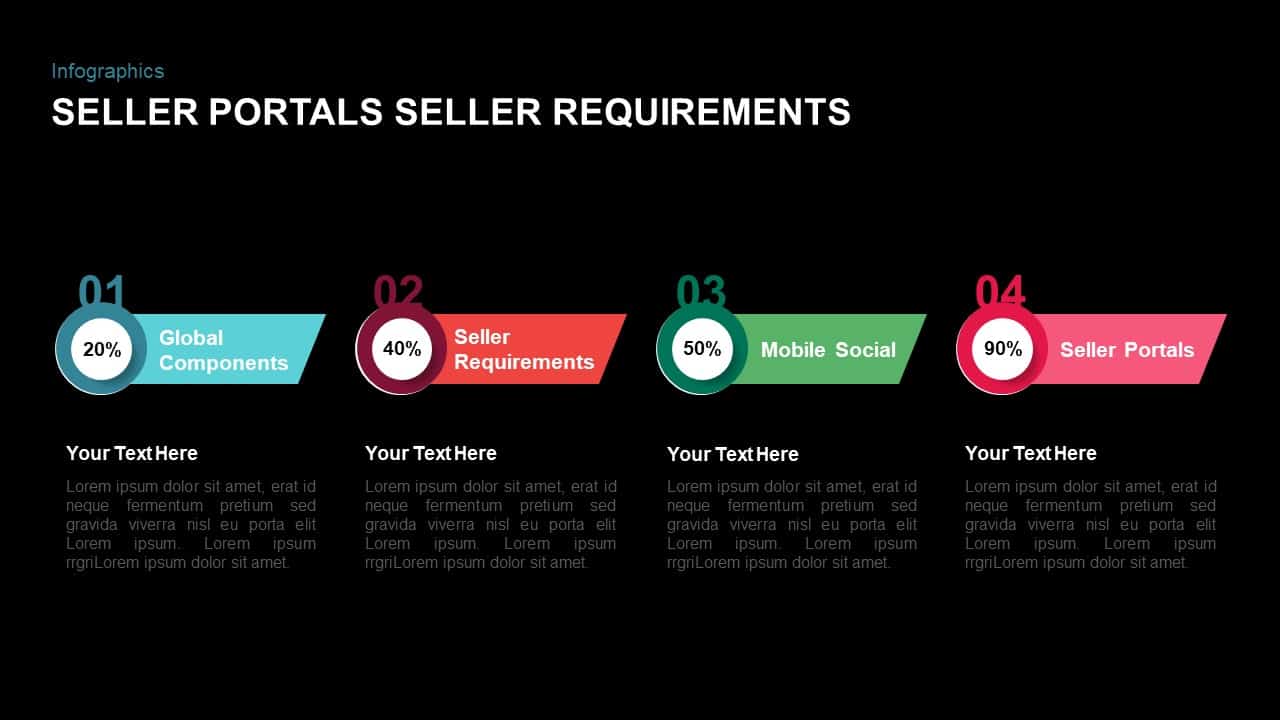

Leverage this dynamic seller portals infographic to illustrate requirements distribution and performance metrics with clarity. Featuring a clean white canvas and four horizontally aligned percentage rings, each segment is defined by distinct cyan, burgundy, green, and magenta color accents, anchored by crisp vector icons and bold numbering. The template’s fully vectorized elements reside on master slides—enabling instant color adjustments, icon swaps, and resizing without loss of fidelity. Percentage circles are linked to angled callout shapes where you can insert headings and descriptive text, supported by versatile placeholder blocks for detailed notes. Connectors maintain consistent spacing and adjust automatically when elements are moved, streamlining layout modifications. Built-in copy layouts include alternative infographics and callout styles to suit a variety of presentation contexts.
This asset supports animated reveal sequences in PowerPoint, so you can spotlight each requirement one at a time, guiding audience focus and enhancing storytelling impact. Extensive speaker notes accompany the slide, providing step-by-step guidance for applying corporate color schemes, replacing placeholder icons, and adjusting typography to maintain brand consistency. Whether mapping out global components, delineating seller portal prerequisites, showcasing mobile and social integrations, or summarizing workflow benchmarks, this template streamlines preparation and elevates audience comprehension. Optimized for PowerPoint and Google Slides, it preserves layout fidelity across devices and simplifies version-control challenges.
Customization options are virtually limitless: toggle between saturated and muted palettes, swap percentage circles for progress bars or donut charts, embed data visualizations within each segment, or integrate custom imagery. Duplicate, reorder, or resize segments to craft new scenario analyses, performance dashboards, or training modules. Ideal for e-commerce strategy sessions, product launch briefings, or stakeholder reviews, this infographic empowers teams to present complex requirement matrices with precision and professionalism.
Who is it for
E-commerce managers, business analysts, and project leads will use this infographic to compare seller requirement categories, track compliance metrics, and guide stakeholder discussions. Marketing teams and consultants can adapt the layout for client workshops, roadmap presentations, or performance reviews.
Other Uses
Repurpose this slide for comparative product feature breakdowns, quarterly KPI reports, or resource allocation summaries. Swap icons and labels to showcase customer journey stages, budget distributions, or operational benchmarks in any strategic presentation.
Login to download this file
Add to favorites
Add to collection

Item ID
SB01429