search

Essentials

Must-have decks for quick wins

By Industry

Professionally tailored slides for every sector

By Style

Minimal, modern and creative designs

By Topic

Explore slides curated by purpose and theme

TimelineTimelineRoadmapRoadmapStrategyStrategyGoalsGoalsTableTableComparisonComparisonSWOTSWOTAgendaAgendaArrowArrowWorld MapWorld MapMapsMapsProcessProcessFunnelFunnelTeamTeamOrg ChartOrg ChartPyramidPyramidCircularCircular

Business PlanBusiness PlanBusiness StrategyBusiness StrategyBusiness ProposalBusiness ProposalBusiness ModelsBusiness ModelsDigital MarketingDigital MarketingMarketing FunnelMarketing FunnelCustomer ExperienceCustomer ExperienceProject StatusProject StatusGantt ChartGantt ChartRecruitmentRecruitmentEmployee PerformanceEmployee PerformanceLeadershipLeadershipAIAIMachine LearningMachine Learning

AI Presentation Maker

Install the Windows plugin for quick access to templates and design tools.

AI Infographics Maker

Use our Office 365 add - in to access templates directly from the cloud.

Exe Version

Install the Windows plugin for quick access to templates and design tools.

Office 365

Use our Office 365 add - in to access templates directly from the cloud.

Mac Version

Get the Mac plugin to easily browse, insert, and customize templates and visuals within PowerPoint.

Car Companies Sales Pie Chart PowerPoint Template

This template is part of a deck featuring multiple slides. To check out all slides, click on See All. See All round right arrow
Car Companies Sales Pie Chart Template

Description

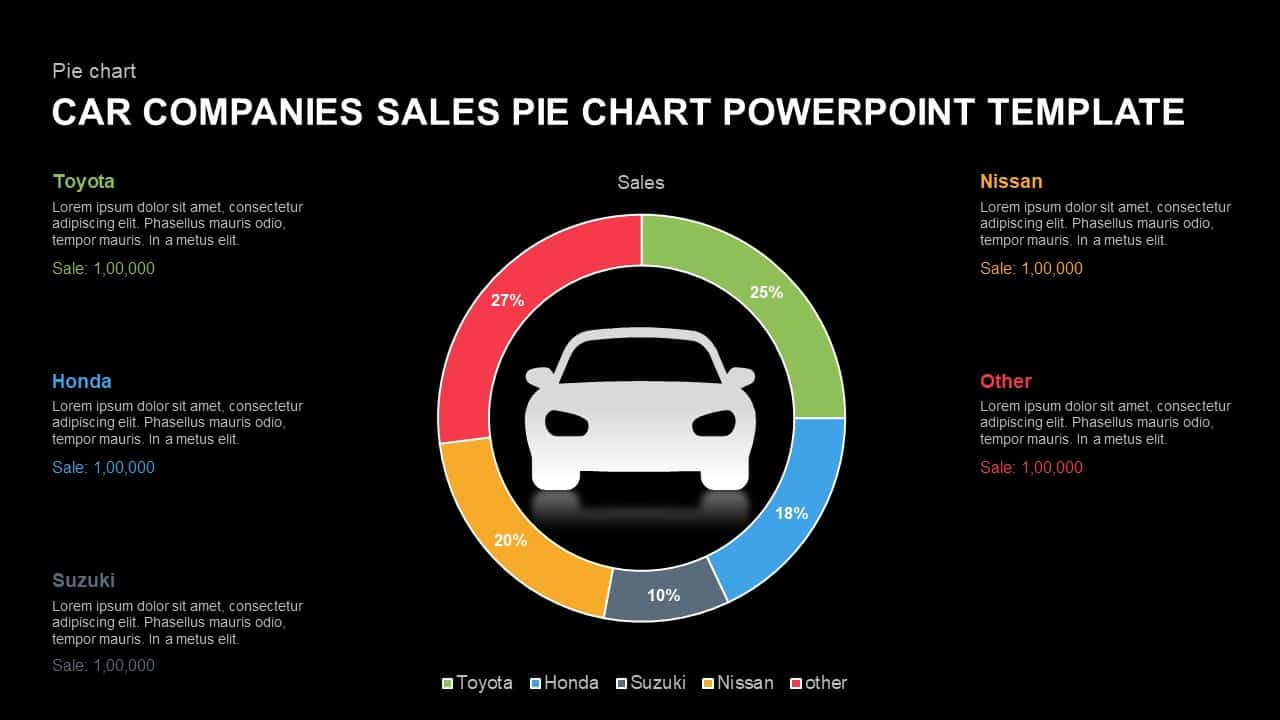
This slide presents a colorful donut chart to visualize car company market share across five segments: Toyota, Honda, Suzuki, Nissan, and Other. Each slice uses a distinct hue—green, blue, gray, orange, and red—and displays percentage labels for quick comparison. A central car icon reinforces the automotive context, while subtle drop shadows and clean typography maintain a modern, professional look. Fully editable vector shapes and master-slide integration allow you to swap icons, adjust segment colors, or update data labels in seconds without disrupting the layout. Ideal for illustrating sales performance, market analysis, or competitive benchmarking, this infographic slide keeps your audience engaged and focused on key metrics.

Who is it for

Sales directors, marketing analysts, business strategists, and automotive industry professionals will leverage this chart to communicate market share insights, sales targets, and competitor performance.

Other Uses

Repurpose this template for any category-based distribution such as product portfolio splits, budget allocations, customer segmentation, or performance dashboards. Simply relabel slices and adjust percentages to fit diverse business scenarios.

Login to download this file