


Entertainment Industry PowerPoint Template

Description
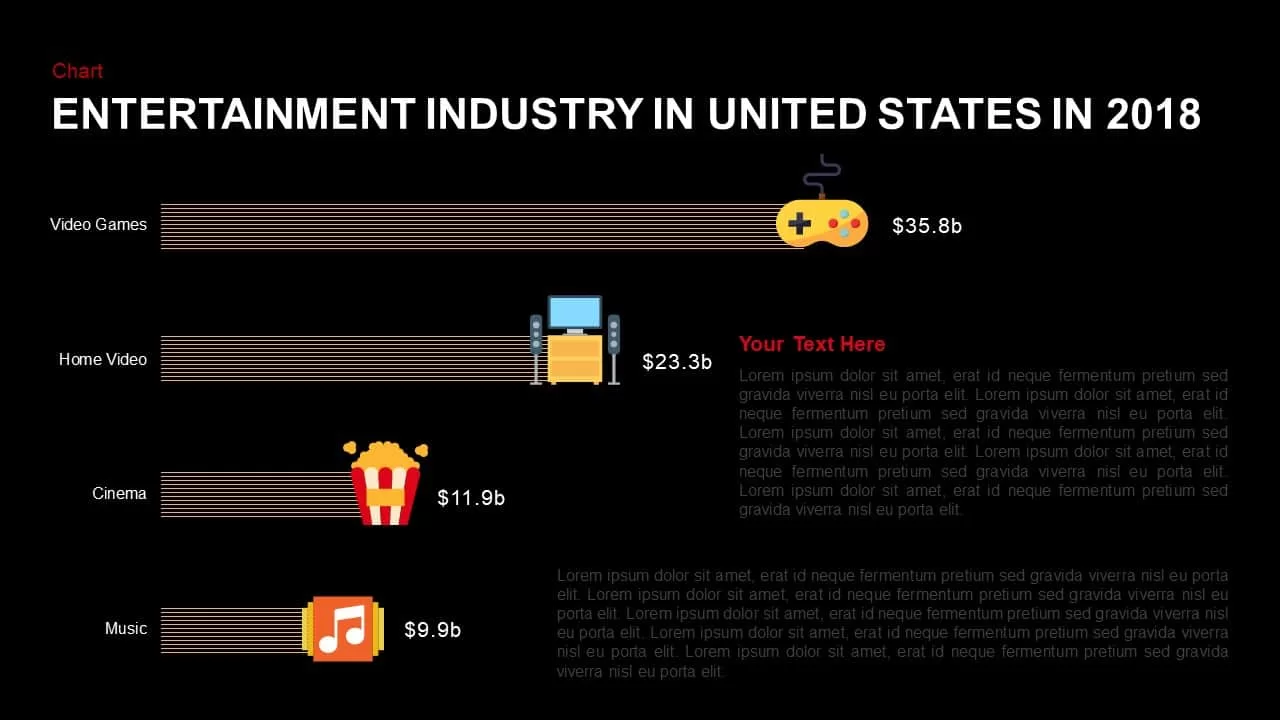
Leverage this entertainment industry bar chart slide to compare revenue streams in the U.S. market for 2018 with ease and visual clarity. This infographic features four horizontal striped bars—each topped with a distinctive icon (yellow game controller, blue TV setup, red-and-yellow popcorn bucket, and orange music note)—representing video games, home video, cinema, and music revenues. Value labels at the end of each bar highlight exact figures, while clean typography and generous white space ensure rapid comprehension. A prominent chart title anchors the top of the slide, and an adjacent sidebar text placeholder offers space for insights, strategic commentary, or key takeaways, complemented by a secondary narrative area for extended notes.
Designed for seamless customization, this template includes master slides, fully editable vector icons, and defined text placeholders that let you update revenue figures, swap icons, or adjust bar lengths in seconds. Change stripe colors, reposition the sidebar block, or tailor the title to your brand’s voice without disrupting the layout. Built-in alignment guides and layout grids guarantee consistent spacing and professional alignment across all elements.
Optimized for both PowerPoint and Google Slides, this slide renders flawlessly on any device and eliminates versioning headaches. Beyond entertainment analysis, repurpose this framework for financial comparisons, market share breakdowns, product category revenues, KPI tracking, or departmental budget reviews. Whether you’re preparing a business review, investor pitch, or strategic workshop, this versatile chart helps you present multi-category data with maximum impact and minimal effort.
Who is it for
Business analysts, financial planners, and marketing managers will benefit from this bar chart when comparing revenue streams across categories. Consultants, product teams, and educators can also use it to illustrate market breakdowns or teach data visualization best practices in boardroom presentations and training sessions.
Other Uses
Repurpose this slide for any multi-category comparison—such as sales channel performance, cost center analysis, ROI reporting, or departmental budgets. It’s equally effective for KPI dashboards, social media engagement charts, website traffic sources, or product portfolio reviews.
Login to download this file
Add to favorites
Add to collection

Item ID
SB01319