


Product Comparison Template for PowerPoint

Description
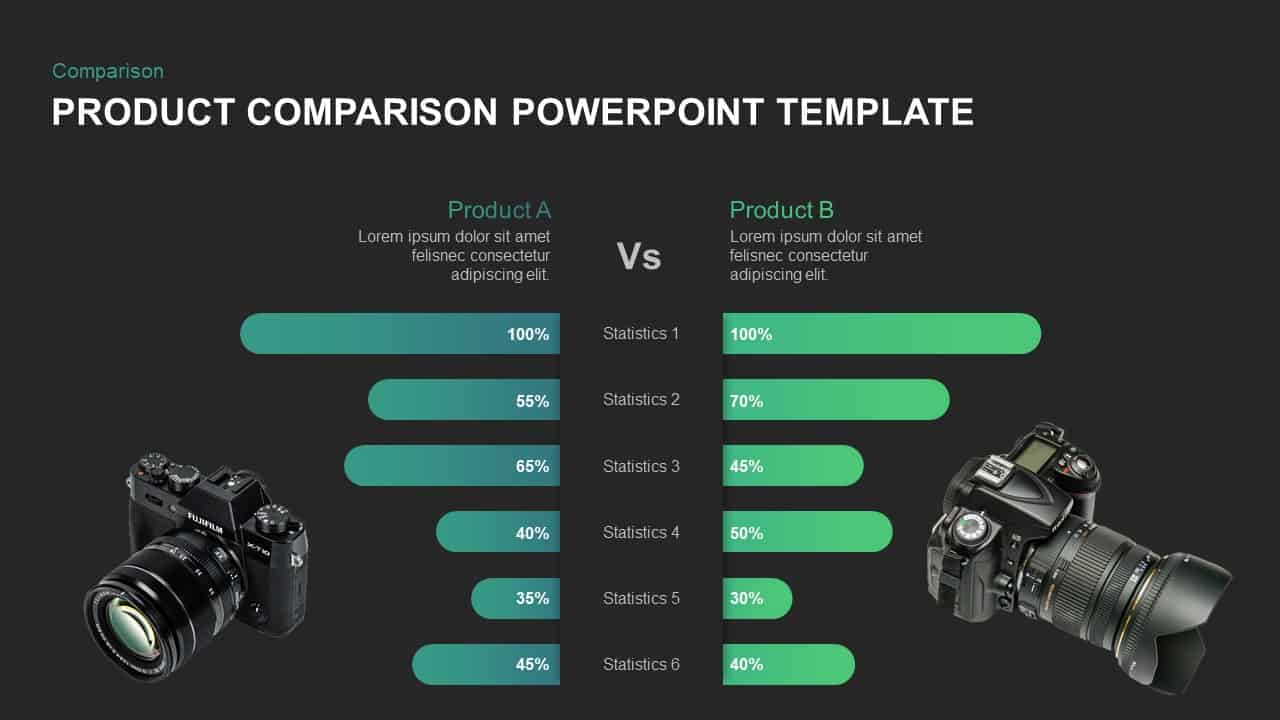
Transform raw product data into a clear visual narrative with this six-metric comparison slide, showcasing side-by-side bar charts anchored by contrasting camera product imagery. The left and right panels represent Product A and Product B, each with six horizontally oriented bars rendered in a smooth green gradient that fades from cyan-teal to lime. Each bar is labeled with percentages—100% vs. 100%, 55% vs. 70%, 65% vs. 45%, 40% vs. 50%, 35% vs. 30%, and 45% vs. 40%—to highlight performance across six key criteria. The central “Vs” motif and statistic labels maintain symmetry and draw attention to comparative data, while ample white space and minimalist iconography preserve a professional aesthetic.
Built with fully editable vector elements and master-slide architecture, this template empowers you to customize colors, adjust bar lengths, and swap imagery without disrupting the layout. The uncluttered white background ensures readability, and the gradient bars add a modern flair. Easily change metric labels, import custom icons, or replace camera photos to suit your product categories. Optimized for both PowerPoint and Google Slides, the slide guarantees consistent formatting, seamless collaboration, and rapid updates across devices.
Ideal for marketing reviews, stakeholder presentations, and product strategy sessions, this slide turns complex performance metrics into instantly digestible visuals. Animate individual bars or fade in camera images to guide your audience through each comparison point. Use this template to support competitive analyses, feature evaluations, pricing comparisons, or quality assessments, providing clear insight that drives decision making. With its versatile design, this template can be extended to other product lines or service offerings, making it a go-to asset for cross-functional teams.
Who is it for
Project managers, marketing teams, product strategists, business analysts, sales directors, and consultants looking to present clear side-by-side comparisons of product performance metrics.
Other Uses
Beyond camera products, repurpose for software feature comparisons, service plan evaluations, pricing model analyses, quality assessments in manufacturing, or any scenario requiring a visual six-point comparison.
Login to download this file

Item ID
SB01288