


water cycle precipitation collection PowerPoint template
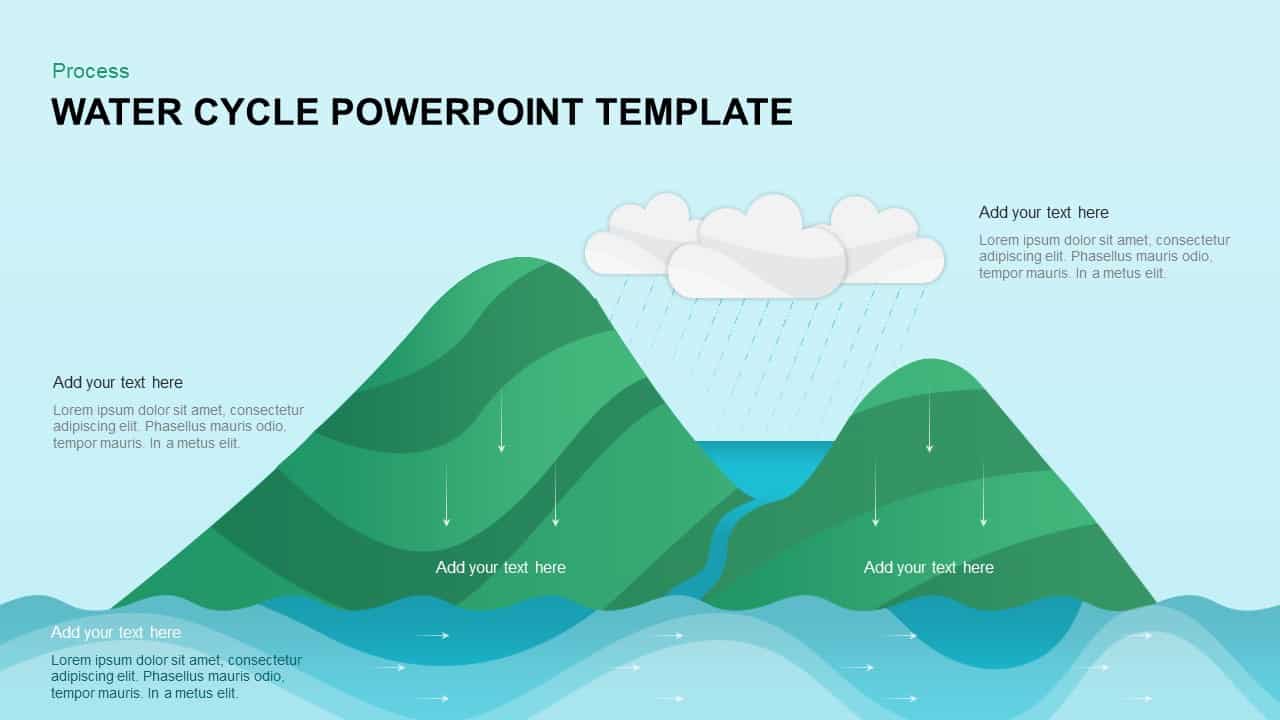
This slide pack illustrates the natural water cycle across multiple master slides in PowerPoint and Google Slides. The main slide features layered vector shapes depicting ocean waves, mountain peaks, a river valley, rain clouds, sun, and evaporation arrows, all set against a soothing sky-blue backdrop. Text placeholders above each icon or along flow paths allow you to describe precipitation, surface runoff, infiltration, evaporation, and condensation. A hidden abstraction shape under the text adds depth while maintaining clarity.
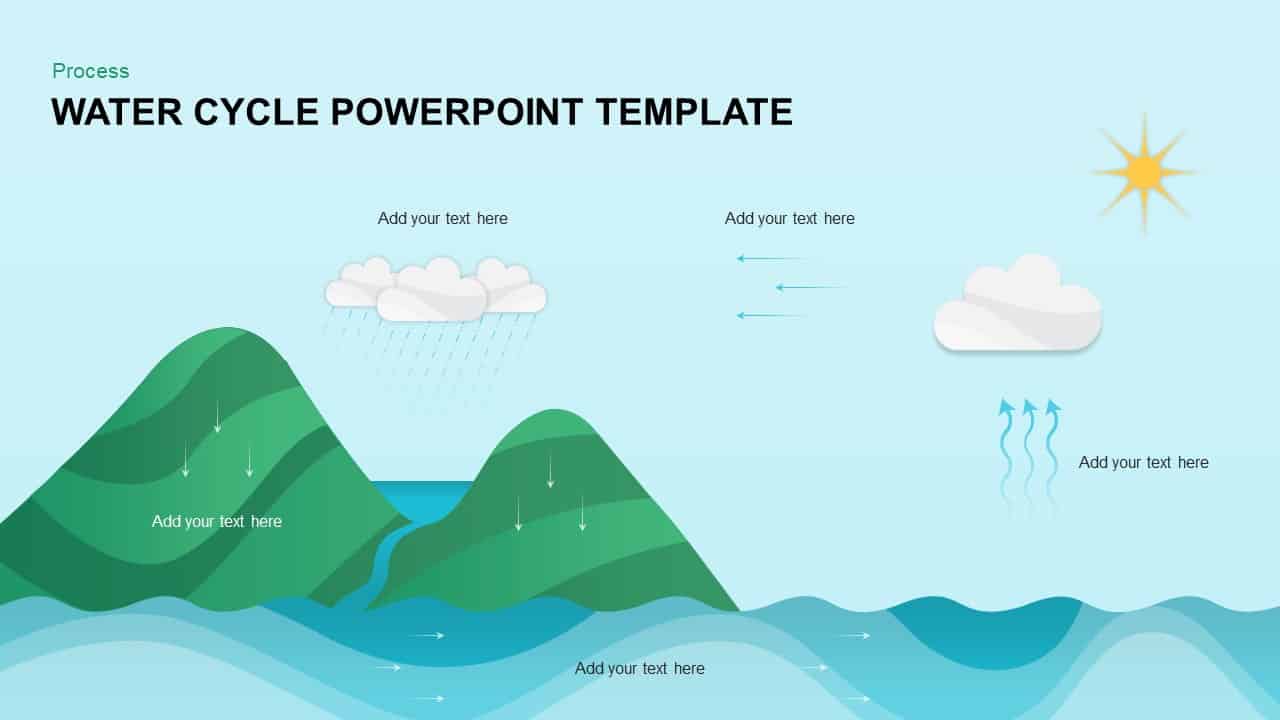
Additional layout variants reposition elements—sun on the left, clouds on the right, or full-screen ecological scenes—so presenters can emphasize specific stages. All objects are vector-based, grouped, and fully editable via slide masters: adjust gradient fills on hills, change cloud shapes, recolor the river, or swap icons without disrupting alignment. Slide-size presets support widescreen (16:9) and standard (4:3) formats, and high-resolution graphics guarantee crisp rendering on projectors, printouts, and digital platforms.
Grouped layers and predefined color themes accelerate brand alignment—apply corporate palettes, update fonts, or set global effects in seconds. Optional drop-shadow and mask controls let you toggle stylistic elements for print or web accessibility. With drag-and-drop ease, reorder cycle stages, hide unused objects, or add custom labels for water management, environmental studies, or educational modules. Modular design empowers you to duplicate, delete, or repurpose shapes for process diagrams, resource flows, or hydrological presentations. Use built-in animations to animate flow arrows during live sessions or export static infographics for reports. This water cycle template transforms complex ecological processes into an engaging, easy-to-understand visual narrative.
Who is it for
Environmental scientists, educators, and sustainability officers can leverage this template for academic lectures, corporate sustainability reports, and NGO outreach. Geography teachers and hydrology consultants will benefit from its visual clarity when explaining precipitation, runoff, and evaporation processes.
Other Uses
Repurpose this layout to illustrate nutrient cycles, ecosystem services, energy flows, or supply chain stages. Adapt the vector shapes to map organizational workflows, feedback loops, or any cyclical process in corporate training and technical workshops.
Login to download this file

Item ID
SB01229