


Canada map population template for PowerPoint
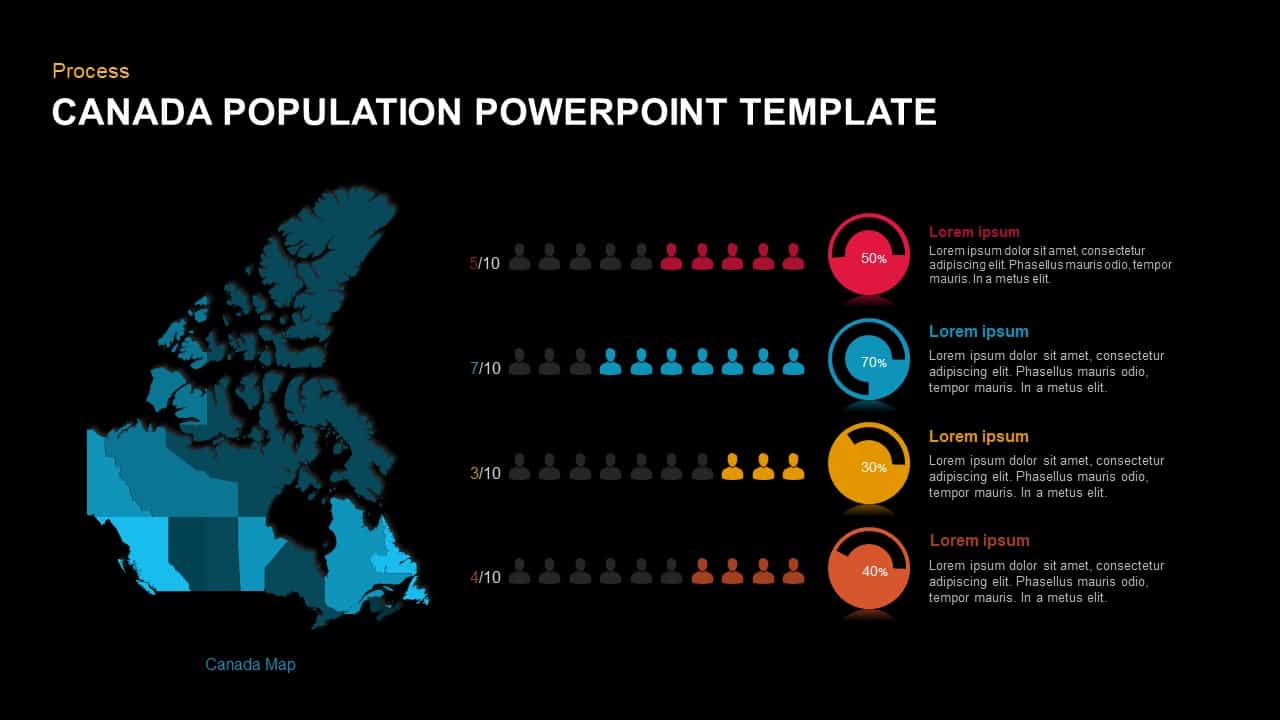
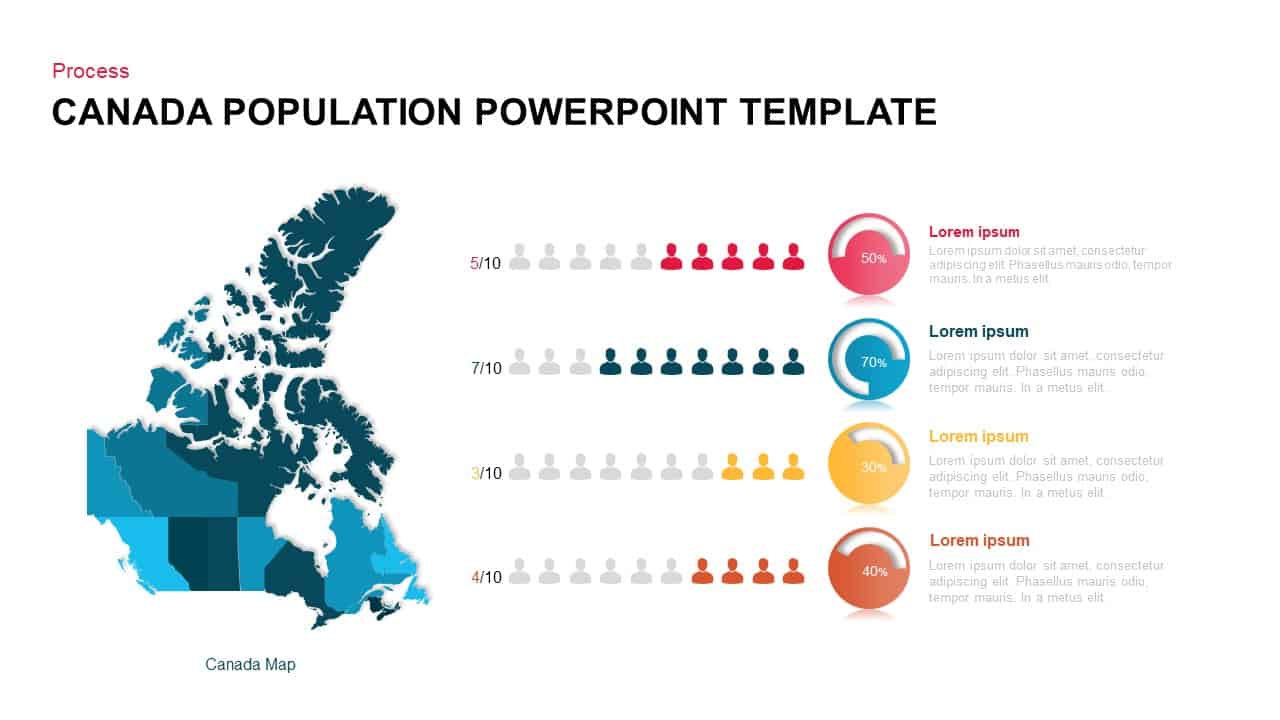
This slide presents a fully editable demographic infographic featuring a vector map of Canada alongside four horizontal population metrics. The multi-hued map highlights provincial regions with customizable color gradients, while each metric row displays a 10-person silhouette chart (5/10, 7/10, 3/10, 4/10) paired with a matching circular gauge (50%, 70%, 30%, 40%). Color-coded gauges, numeric labels, and placeholder text fields allow you to annotate region names, survey results, or demographic insights.
Built as a master-slide asset for PowerPoint and Google Slides, every element—map fills, icon sets, gauge segments, and typography—is vector-based and fully editable via the slide master. Swap out placeholder icons, adjust percentage values, recolor provinces, or alter gauge styles through predefined theme controls without disturbing alignment. The modular design lets you duplicate, hide, or reorder metric rows to accommodate additional data points or scenarios.
Preconfigured for both widescreen and standard formats, this template ensures crisp rendering on projectors, handouts, and digital platforms. Grouped objects and predefined color themes accelerate brand alignment—apply corporate palettes, swap icons, or update labels in seconds. Optional background masks can be toggled on or off to suit your deck’s aesthetic. Accessibility features such as high-contrast outlines and clear numeric callouts enhance readability for diverse audiences.
With this Canada population infographic, you can transform complex regional data into an intuitive visual narrative, ideal for census reports, market analyses, and stakeholder presentations.
Who is it for
Policy analysts, market researchers, and government agencies for census reporting and regional planning. Corporate strategy teams, sales managers, and academic researchers for comparative demographic analyses.
Other Uses
Repurpose for survey results, resource allocation, public health metrics, or sales performance by province. Adapt the layout for environmental impact studies, educational briefings, or regional risk mapping.
Login to download this file
Add to favorites
Add to collection

Item ID
SB01222