


Venn diagram template for PowerPoint

Leverage this versatile Venn diagram infographics pack to visualize complex relationships, overlaps, and intersections across any analytical context. This comprehensive collection includes fully editable layouts for two-set, three-set, four-set, and five-set circle diagrams, each rendered with crisp vector art, gradient fills, and optional reflection effects. Intuitive placeholders let you insert labels, icons, and descriptive text for every segment, while central intersection areas highlight shared attributes or core concepts. Master slide support and SmartArt integration ensure effortless resizing, recoloring, and theme application without compromising clarity or resolution in both PowerPoint and Google Slides.
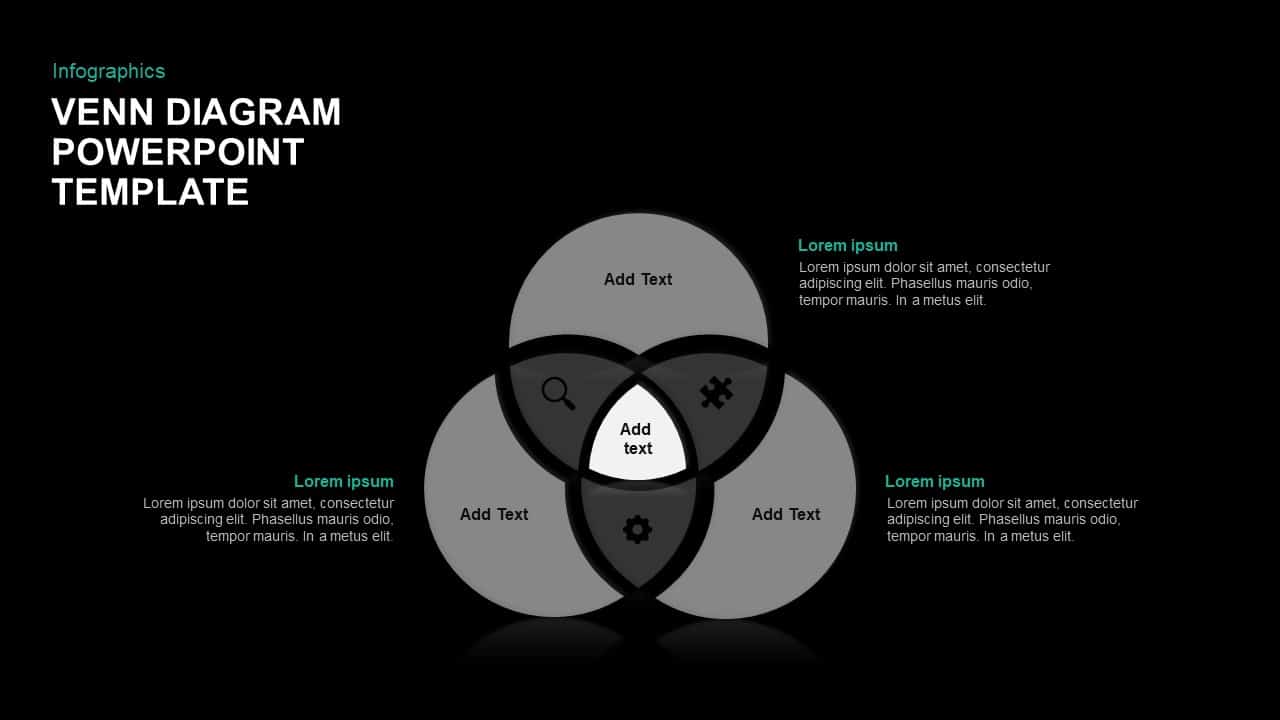
Engineered for adaptability, the pack offers multiple color themes and editable vector icons—magnifier, puzzle piece, target, gear, and more—to suit marketing analyses, strategic planning, resource mapping, or academic presentations. Simply swap shapes or adjust individual circle colors to align with corporate branding or project aesthetics. The clean, high-contrast layouts guarantee legibility on projector screens, printed handouts, and virtual meeting platforms. Use the five-circle version to depict multi-dimensional frameworks, the four-circle layout for cross-functional comparisons, the three-circle variant for core value intersections, or the two-circle option for simple binary contrasts.
Whether you’re preparing stakeholder analyses, process comparisons, competitive landscapes, or educational workshops, these infographics streamline data storytelling and decision-making. Duplicate slides to create sequential overlays, animate individual segments to guide audience focus, or combine multiple diagrams within a single deck for layered insights. Fully optimized for collaborative editing, this pack reduces manual formatting and accelerates slide creation. Empower your presentations with dynamic Venn visuals that transform abstract ideas into clear, impactful infographics.
Who is it for
Analysts, consultants, marketers, educators, and project teams will benefit from these Venn diagram infographics when clarifying relationships, comparing data sets, or illustrating framework overlaps.
Other Uses
Beyond relationship mapping, repurpose these diagrams for feature comparisons, process modeling, audience segmentation, risk assessments, or innovation frameworks. The flexible circle layouts also support SWOT analyses, customer journey breakdowns, and product positioning overviews—simply adjust colors and labels as needed.
Login to download this file

Item ID
SB01218