


Radar chart product comparison template for PowerPoint
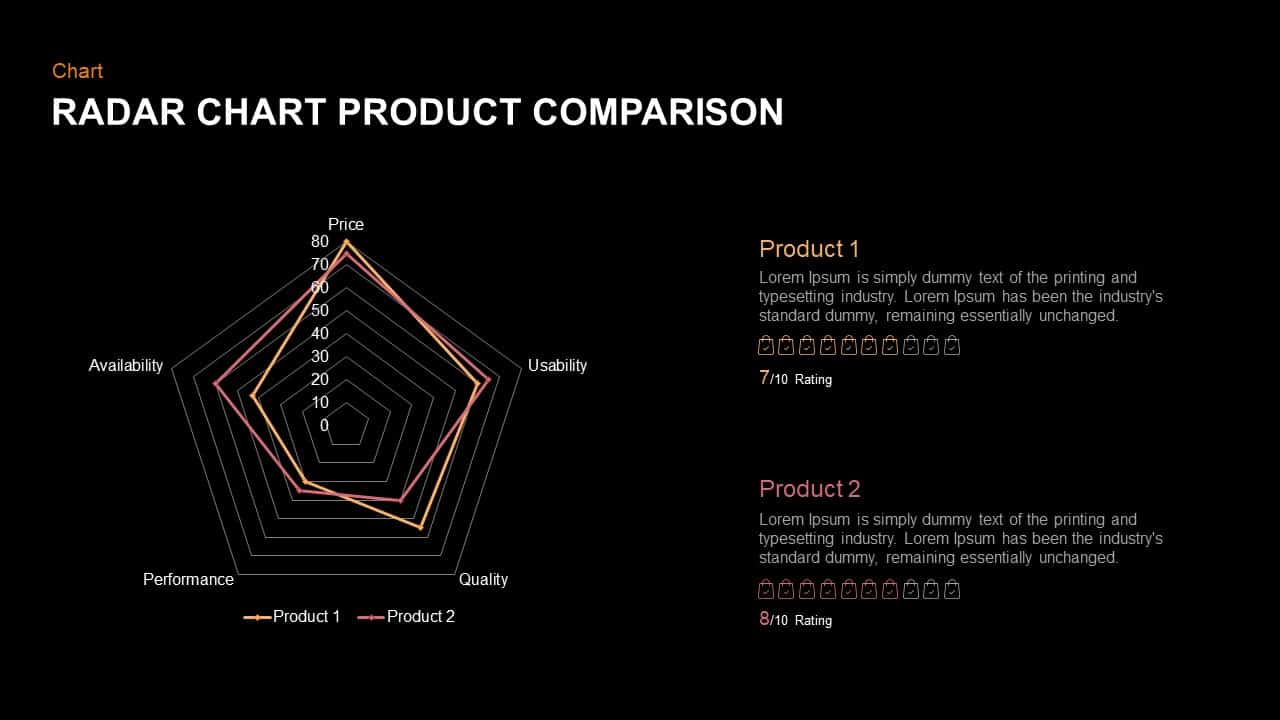

Download this versatile radar chart slide to compare multiple products across key metrics—Price, Usability, Quality, Performance, and Availability—with precision and style. Two distinct data series (Product 1 in orange, Product 2 in red) plot seamlessly on a pentagonal grid, allowing you to highlight strengths and identify areas for improvement at a glance. Editable axis labels, gridlines, and data points let you tailor the chart to your specific categories and scales. Use the adjacent text panels to provide context, summarize findings, or call out critical insights and ratings with clarity.
Built on master slides with fully editable vector graphics, you can adjust line colors, marker shapes, axis ranges, and category names in seconds—ensuring consistency with your brand guidelines. Preconfigured entrance animations reveal each product’s data sequentially, guiding your audience through a logical comparison and maintaining engagement. Compatible with both PowerPoint and Google Slides, this template preserves pixel-perfect clarity on any device and simplifies collaborative editing by locking formatting elements.
Whether you’re evaluating competitor offerings, benchmarking feature sets, or presenting performance dashboards, this radar chart empowers you to transform complex data into an intuitive visual narrative. Replicate the slide for multiple comparisons, add or remove metrics as needed, and customize the color palette to match your corporate style—all without compromising design integrity or readability.
Who is it for
Product managers, marketing analysts, and business consultants will use this slide to benchmark offerings, support data-driven decisions, and align stakeholders on strategic priorities. Sales teams, R&D groups, and executive leadership can leverage its clear visual format to communicate competitive insights and product roadmaps.
Other Uses
Repurpose this layout for skill-gap analyses, customer-satisfaction surveys, or project-risk assessments by renaming axes and updating data series. Duplicate or hide data series to compare up to three products or scenarios in a single slide.
Login to download this file

Item ID
SB01205