


Global Map PowerPoint Slide
Description
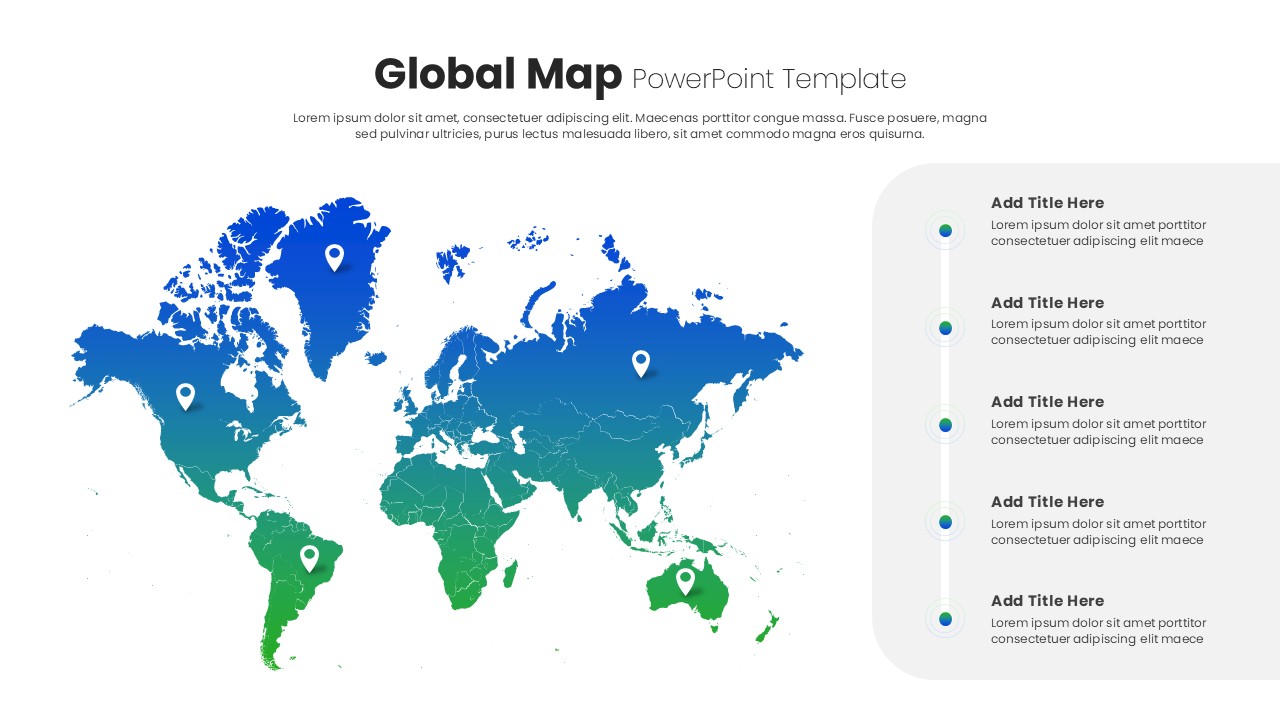
Visualize your global footprint with this high-impact world map slide featuring gradient fill from blue to green and five location callout markers. Each marker links to a circular icon and text placeholder on the right-hand vertical timeline panel, making it easy to highlight key regions, offices, or market segments. The crisp vector map outlines continents with precise borders, while the clean white slide background and subtle drop shadow on the callouts ensure maximum readability. Bold headlines and concise descriptions allow audiences to quickly scan and retain critical location-based insights.
Built for seamless customization, this template leverages organized master slides, editable text placeholders, and fully scalable vector shapes. Adjust region labels, swap icons, or modify the gradient color stops in seconds—no advanced design skills required. Alignment guides and smart objects guarantee consistent formatting, while the built-in layout works flawlessly across PowerPoint and Google Slides. High-resolution output maintains clarity on any screen size, enabling smooth collaboration and error-free sharing in virtual or live presentations.
Beyond global mapping, this versatile infographic is ideal for sales territory assignments, expansion strategy planning, executive briefings, supply chain visualizations, customer distribution analysis, and investment location comparisons. Repurpose the callout panel to display performance metrics, project timelines, or risk assessments tied to specific regions. Whether you’re presenting market entry plans, regional KPIs, or global resource allocation, this slide empowers teams to communicate complex geospatial data with clarity and impact, driving informed decisions and stakeholder alignment. It streamlines data visualization across departments and makes global insights accessible to stakeholders at all levels.
Who is it for
Marketing leaders, sales managers, expansion strategists, and business consultants will benefit from this slide when illustrating regional insights and global operations. It also supports executive teams, project managers, and analysts requiring clear geospatial presentations.
Other Uses
Repurpose this layout for territory management, supply chain mapping, investor location pitches, or regional performance dashboards. Use the callout panel to showcase sales figures, customer demographics, or project milestones tied to specific geographies.
Login to download this file
Add to favorites
Add to collection

Item ID
SB04991