


Technology Tree Infographics Presentation Slide
Description
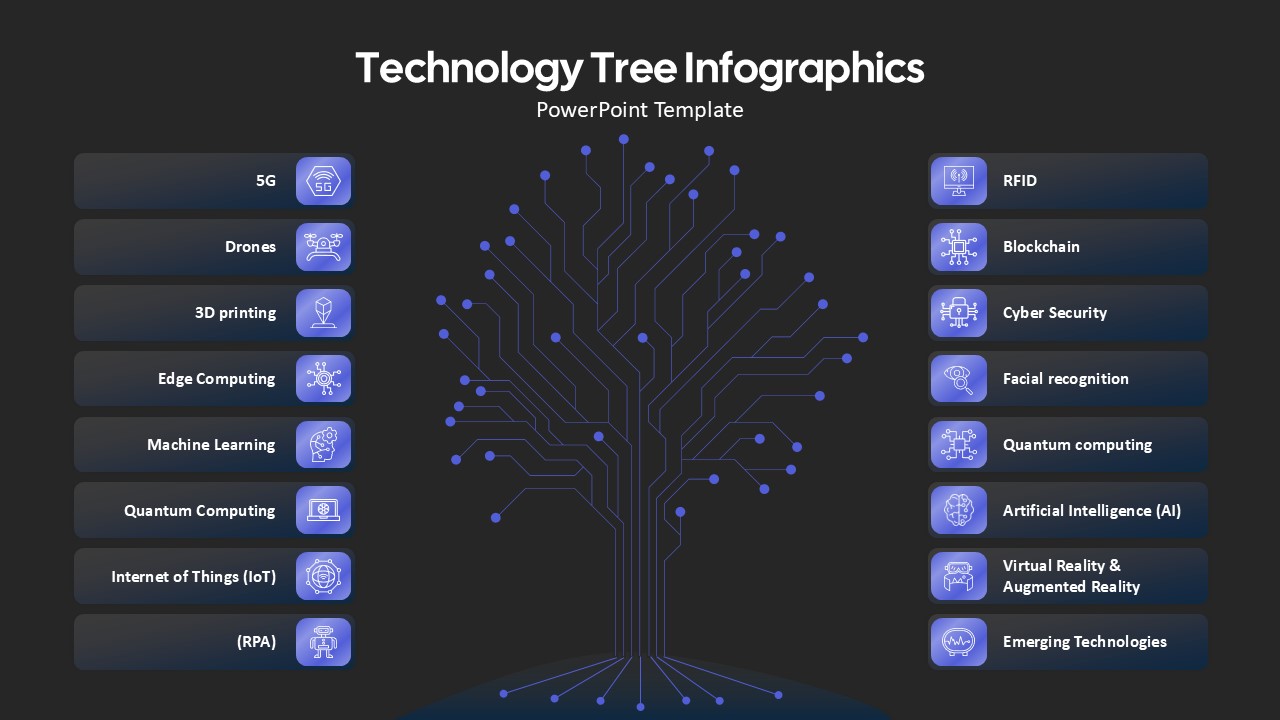
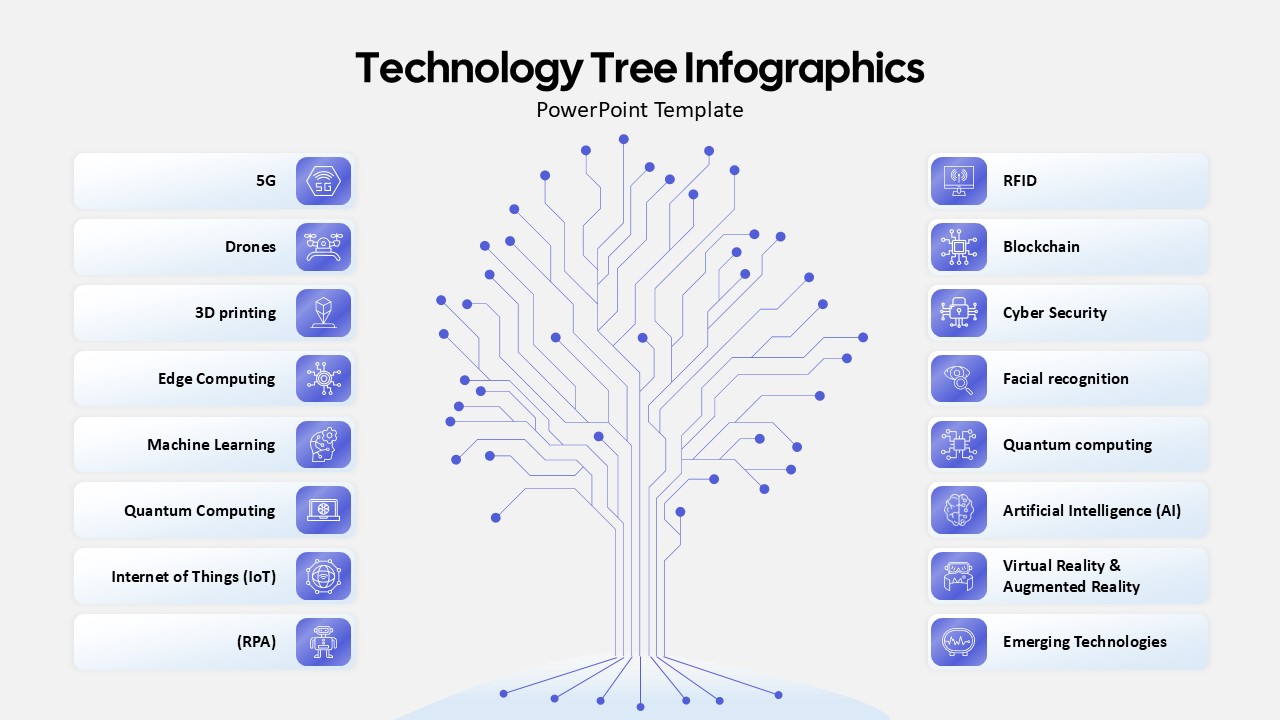
Visualize complex technology ecosystems with this technology tree infographic slide, featuring a central, circuit-like trunk that branches into multiple nodes representing key innovations. Each node aligns with labeled capsules on either side—covering emerging topics such as 5G, IoT, machine learning, blockchain, and virtual reality—enhanced by crisp, vector-based icons. The horizontally balanced layout and consistent color gradients guide audience focus through each technology category, while the clean white background and subtle backdrop gradient maintain visual clarity. Designed to convey hierarchical relationships, this slide simplifies presentation of interdependent technologies in a cohesive, professional format.
Engineered for seamless customization, this template leverages organized master slides, editable text placeholders, and scalable vector shapes, allowing you to adjust labels, replace icons, or modify color stops in seconds. All graphic elements are fully editable within PowerPoint and Google Slides, ensuring consistent formatting and high-resolution output across devices. Whether crafting a board-level technology overview, IT strategy briefing, or innovation roadmap, the intuitive editing workflow enables presenters to tailor the slide to any corporate style guide or brand palette without technical hurdles.
Beyond technology roadmaps, this versatile infographic adapts to numerous use cases: present digital transformation frameworks, illustrate architecture components, map innovation pipelines, or highlight research and development pipelines. You can also repurpose the branching structure to depict organizational hierarchies, skill matrices, or product feature trees. By duplicating node capsules and adjusting labels, teams can showcase business units, project phases, or process flows while preserving design integrity. This slide elevates data-driven storytelling by merging aesthetic precision with structural clarity, making complex relationships accessible to stakeholders at every level.
Who is it for
IT leaders, CIOs, technology strategists, and innovation managers will find this technology tree infographic invaluable for mapping complex ecosystems and aligning stakeholders. Consultants, R&D teams, and project managers can leverage it to illustrate system architectures, product roadmaps, and digital transformation plans.
Other Uses
Besides technology overviews, repurpose this layout to present digital marketing funnels, organizational charts, skill matrices, or milestone trackers. Adjust node labels to visualize supply chains, customer journey stages, or operational processes, providing a clear, hierarchical view of any structured framework.
Login to download this file
Add to favorites
Add to collection

Item ID
SB04965