


Bandura’s Self-Efficacy Theory ppt slide
Description
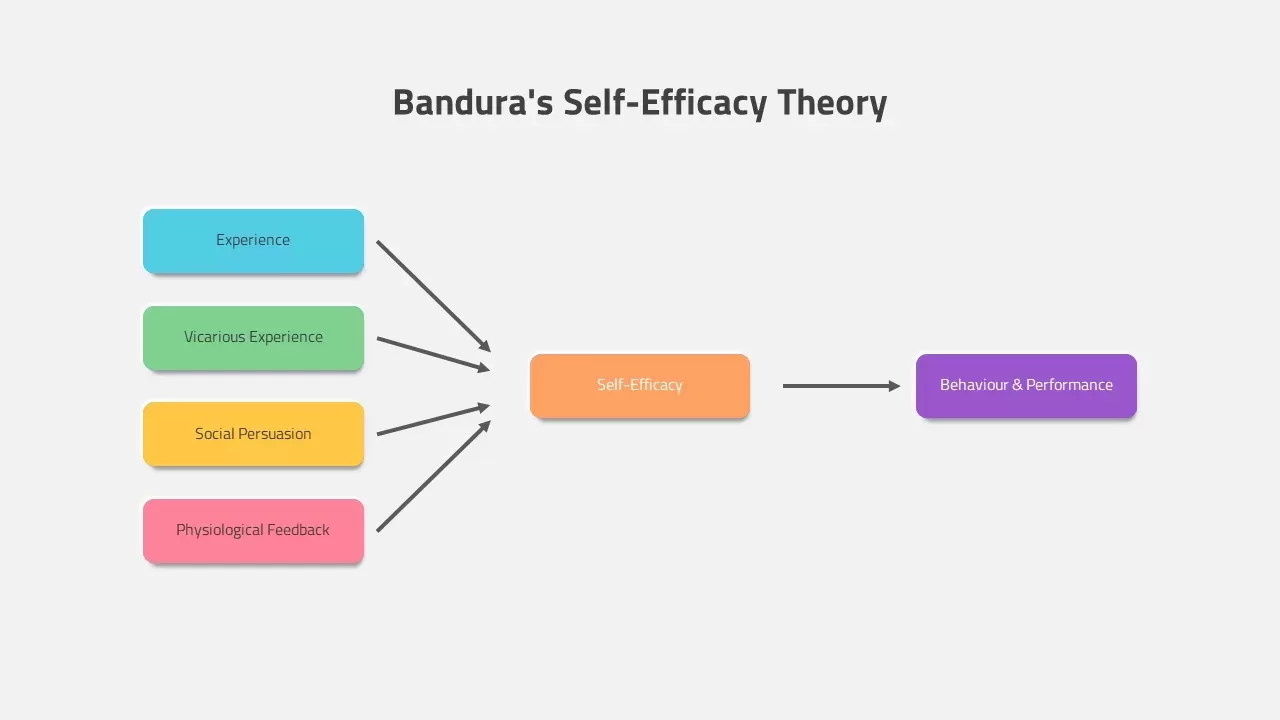
Present Bandura’s Self-Efficacy Theory with a concise flow diagram featuring four colored input blocks—Experience, Vicarious Experience, Social Persuasion, and Physiological Feedback—each connected by arrows to a central Self-Efficacy rectangle, which in turn points to a Behaviour & Performance block. This design uses flat vector shapes and vibrant accent colors on a neutral background to highlight the sequential influence pathways. The input blocks are arranged vertically with directional connectors to emphasize their convergence, while the right-hand output box illustrates the resulting impact on behavior. Subtle drop shadows add depth without distracting from the conceptual flow.
Designed for seamless compatibility with both PowerPoint and Google Slides, the slide provides fully editable vector objects, intuitive drag-and-drop placeholders, and master-slide integration for rapid customization. You can easily recolor each block, adjust arrow styles, or edit text labels to match your corporate palette and terminology. The clean layout and ample white space ensure readability in training sessions, academic lectures, or executive briefings, guiding learners through each factor influencing self-efficacy with clarity.
The modular structure allows you to duplicate or rearrange blocks to adapt the model for related frameworks, such as competency development stages or feedback loops. Seamlessly incorporate this slide into broader decks using your slide master to maintain consistent fonts, colors, and spacing. By streamlining the editing process and preserving design integrity across multiple slides, this asset reduces version-control challenges and accelerates collaborative workflows.
Whether you are an organizational psychologist illustrating cognitive theory, an HR trainer designing motivation workshops, or a leadership coach mapping performance frameworks, this slide adapts easily to diverse professional contexts. Use it to reinforce training modules, stakeholder presentations, or academic research discussions, ensuring every audience grasps the drivers behind effective self-efficacy and performance outcomes.
Who is it for
Organizational psychologists, HR trainers, and leadership coaches will benefit from this slide when teaching motivation models, facilitating development workshops, or coaching behavior change. Consultants, educators, and L&D professionals can also leverage the clear flow diagram to support academic or corporate training programs.
Other Uses
Repurpose this layout for any four-input process: competency models, feedback cycle diagrams, risk factor analyses, or multi-source decision-making frameworks. Duplicate or relabel blocks to visualize alternate theories, project stages, or performance drivers in diverse presentation contexts.
Login to download this file

Item ID
SB02971