


circular infographic interaction-diagrams
Description
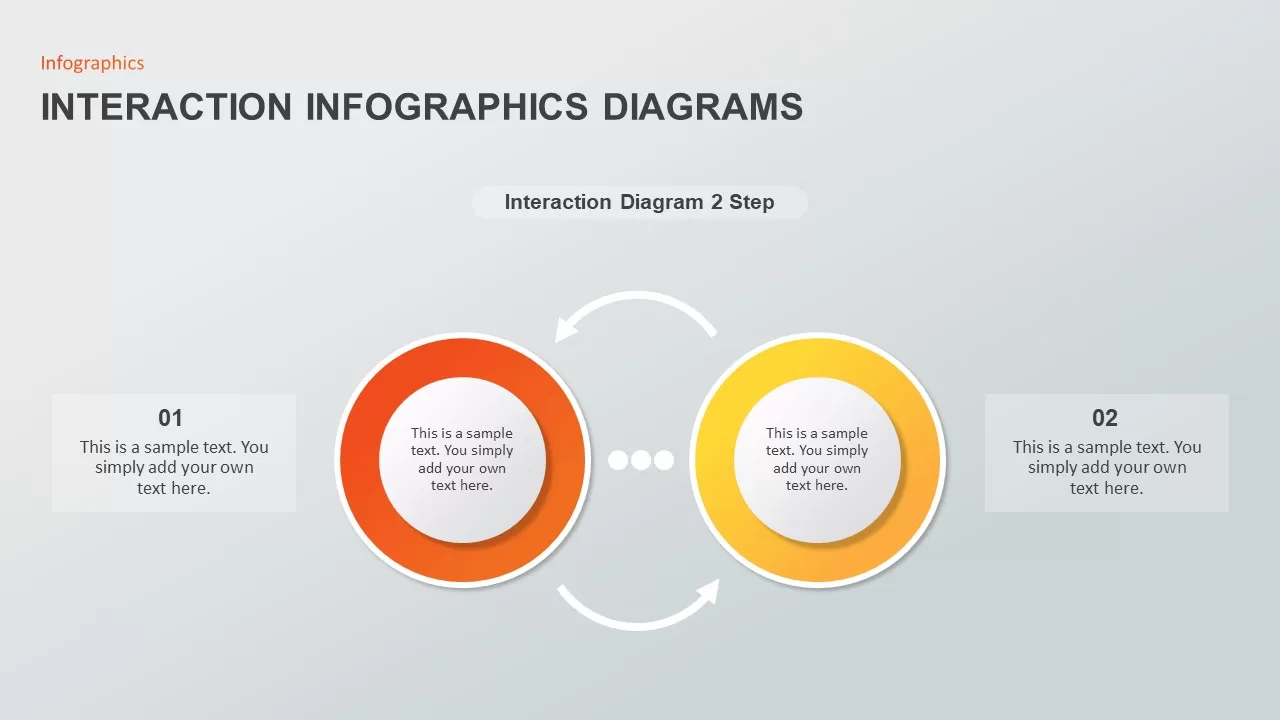
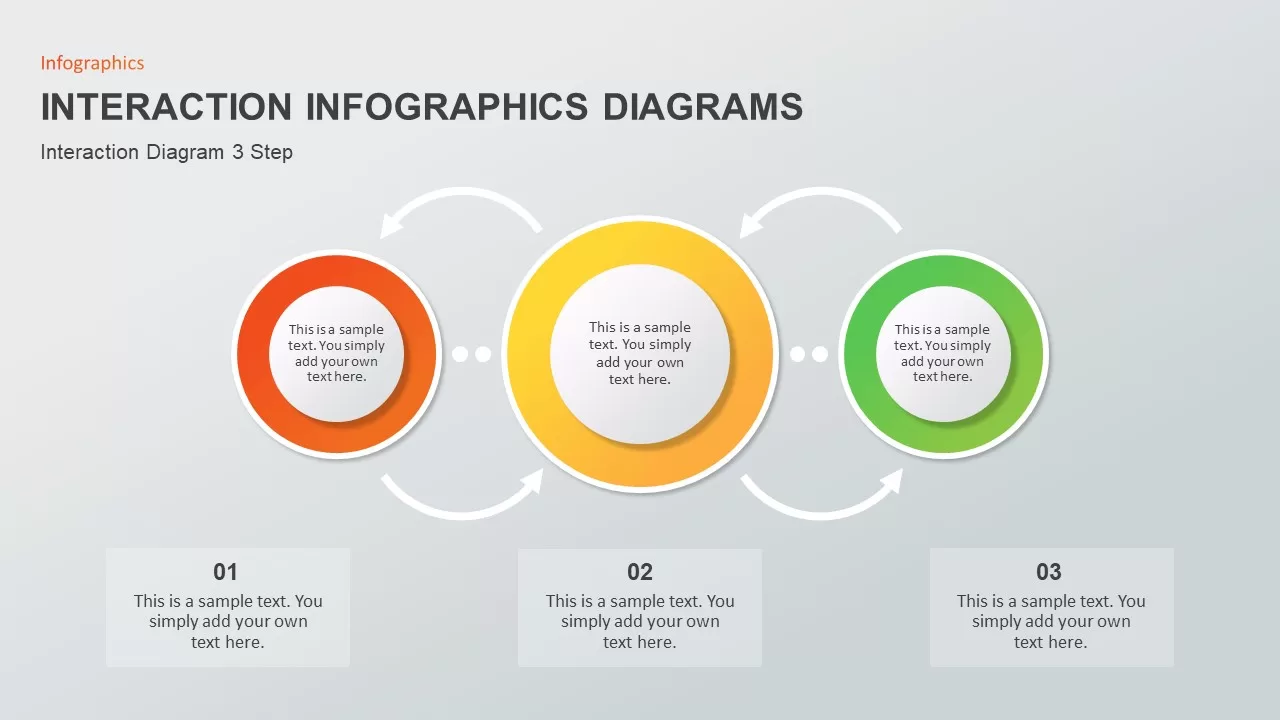
This Interaction Infographics diagram template is designed to visually represent processes, flows, or relationships within a system or organization. It features a sleek, professional design with color-coded circular segments, making it an ideal tool for illustrating sequential steps, interactions, or connections between various elements. The template can be customized to depict a wide range of business, marketing, or project management concepts, from customer journeys and workflow processes to strategy roadmaps.
Perfect for professionals in the business and marketing sectors, this template provides a clean and engaging visual aid that helps audiences grasp complex ideas quickly and easily. The design’s modern and minimalist style enhances the clarity of the diagram, ensuring that each interaction or process is visually distinguished, yet seamlessly connected.
Whether used for presenting internal workflows, business models, marketing funnels, or operational processes, this template serves as a versatile solution for those looking to make impactful presentations. It is fully editable and compatible with both PowerPoint and Google Slides, offering flexibility for a variety of presentation needs.
Who is it for
This template is ideal for marketing managers, business consultants, project managers, and educators who need to present complex systems or processes in a clear, easy-to-understand format. It is especially useful for those presenting on topics like operational flows, marketing strategies, or business interactions.
Other Uses
The template can be adapted to show customer touchpoints, user experiences, multi-step processes, team workflows, or even product development phases. Its versatility makes it perfect for any field that requires the visualization of interconnected processes or relationships.
Login to download this file

Item ID
SB01894