
Importance of flow charts in conveying project management process


If you’re tasked with giving a project management process presentation, you might be wondering what kind of templates and designs will best suit your needs. PowerPoint timelines and roadmaps can be helpful, but they might not give your audience the full picture.
A flow chart can be a valuable addition to your presentation, as it can provide a clear and concise overview of the project management process. By including a flow chart, you’ll be able to illustrate each step of the process in an easy-to-understand manner. This will ensure that your audience walks away with a thorough understanding of the project management process.
Flowcharts are a great tool for understanding the methodology you’ll be using to manage your projects. One of their key features is that they show how processes interact throughout the project life cycle and it’s easy to see what needs done first, second or third in relation to other tasks at any given time – during planning stages; when working on individual items within phases/stages (i e., “Milestoneickers”); after completion when looking back over everything completed successfully but also monitoring whether anything remains outstanding until the next steps can take place accordingly – all depending upon where we’re ultimately headed towards ultimate goal(s).
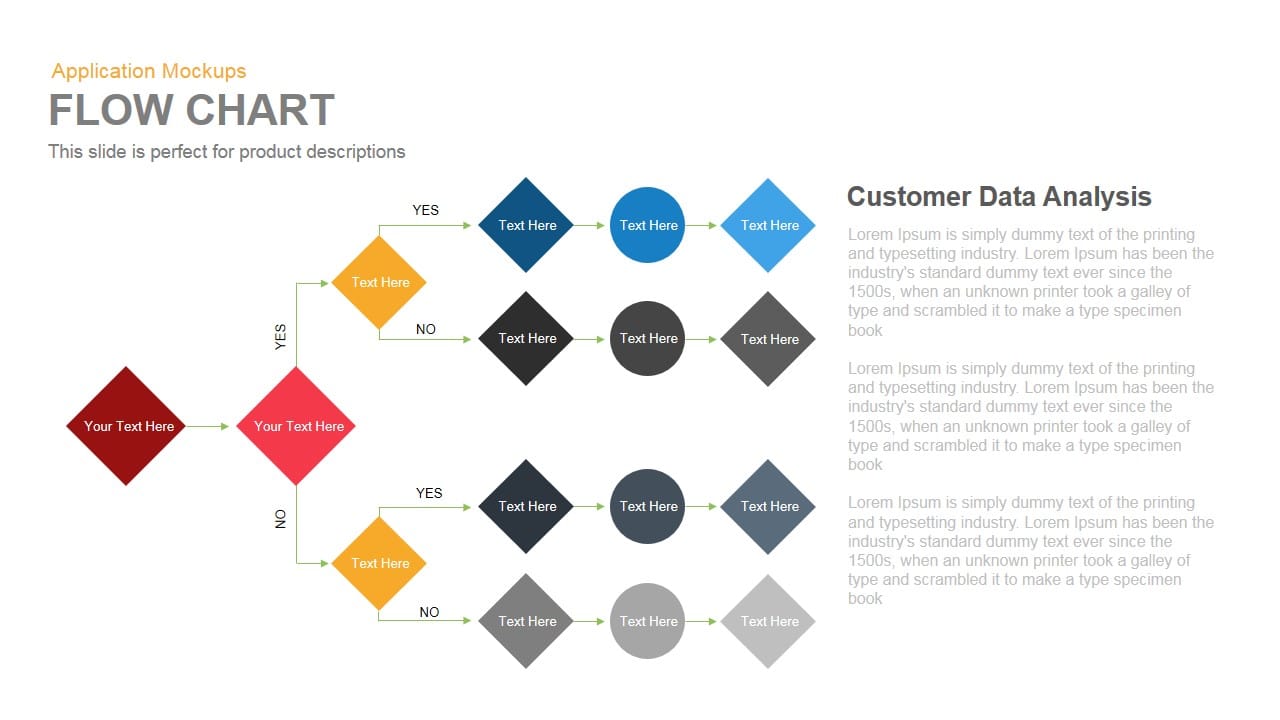
Project managers use a flow chart to offer a clear portrait of the process and to find ways to improve project efficiency. A process flowchart illustrates graphically the project’s objective and seeks to more logically order the activities therein. But, a flow chart can also help with monitoring development and even status reporting. Being a simple graphical representation of steps, it displays project stages in sequential order and is extensively used in reporting workflow, the flow of algorithms or processes. Normally, flowcharts display the steps as boxes of various kinds, and their order by connecting them with arrows. The project management flowchart is one of the many devices you need as a project manager to regulate the project. With this flowchart presentation, you can convey your information through a better channel in order to improve the efficiency of your team members.
What does a flowchart outline?
Whatever you want to outline related to the project management process, you can incorporate it with the flowchart. This is because of the fact that project management is an essential process that connects all other project activities and processes together. You can categorize the project management process with a flowchart and shows its functions from the very initiation. You can segment your project management process with your flowcharts, and give details of each step with eye-catching graphics.
The project management process needs a specific configuration that contains project management documentation; project plans, project management methods, information exchange, resources for the project planning and project implementation. You can also make a flowchart of project management process with main topics and sub-topics like project conception & initiation, definition and planning- plan, charter, scope, resources, budget schedule, approval, execution, assign tasks, performance and control, monitor progress, evaluation, documentation, celebrate.
The planning process is more complex. It starts with planning, collecting required data and the development and scope. The plan, of course, leads to the resources, budgets, schedules, etc. each of those subsets leads to another point in the flow chart, as the risk plan or communications, which in turn flows into the change control plan and quality management. Finally, you may get approval or disapproval, if you get approval, which leads to the executing processor’s disapproval, sending you back to the beginning. So, a flowchart is suitable for project proposal planning and its implementation processes.
The following features should be in action throughout the project management course; project introduction, project planning, project realization, project control, analysis and assessment of the project relevance.
The project process refers to a collection of the procedure as an exclusive action and represents the whole project implementation and the inside processes in the project. Work instructions, methods, network plans and tools are also considered.
A typical flowchart will note the monitoring and control process of the project, which starts with monitoring and control and leads to an integrated change control plan. That guides to quality control, which flows into reporting risk and issues, and so forth. A flow chart can aid in all fashions of project processes, such as the planning of a new product, documenting those procedures and modelling the business process for the project. It can also assist you to accomplish workflow, facts, the auditing process and anything else that is process-based.
A flow chart offers the visual clarity you need to make various processes clear and easy to communicate. A flowchart ordered its events in a sequence that helps your viewers to know the concepts much easier than other visual templates.
What is the difference between flowchart and work breakdown structure?
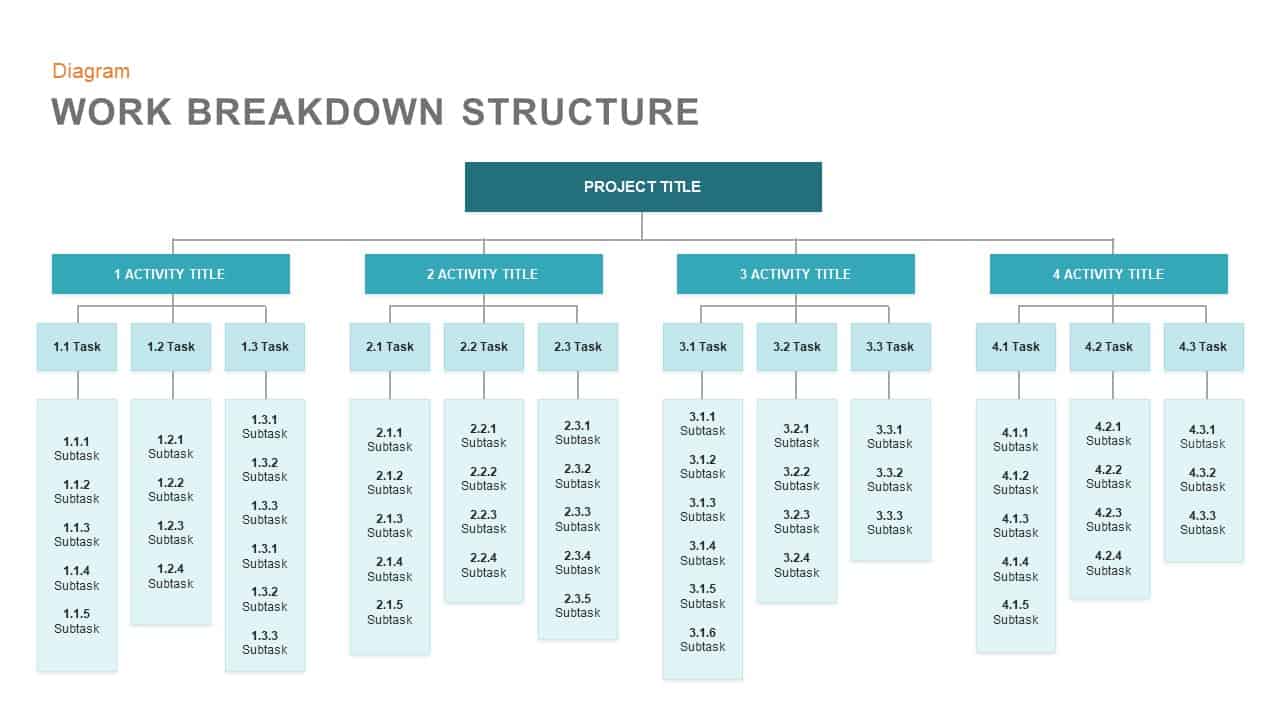
A work breakdown structure displays the work assignments or tasks in a project. It is not worth showing the process, as a project flow chart. A work breakdown structure is a ladder-like decomposition of the project scope that must be done by the project team to create the necessary deliverables. On the other hand, a project management flow chart is a better tool to handle the project process. It is the best device for proper communication and demonstrating the steps spontaneously and systematically.
Flow charts also serve as a good source of documentation and direct through the project’s process. Work breakdown structure is suitable for more specific tasks, whereas a flowchart is a good instrument for showing the overall process of a project.
A project management flow chart is simply a map, certainly, a guide to how you are going to proceed over the course of your project. Through ready-made flowchart symbols and workflow cliparts, a presenter can make an amazing flowcharts for project management that vividly illustrate how your business works. However, making a diagram is a time-consuming effort, so it is better to download.
Benefits of flow charts
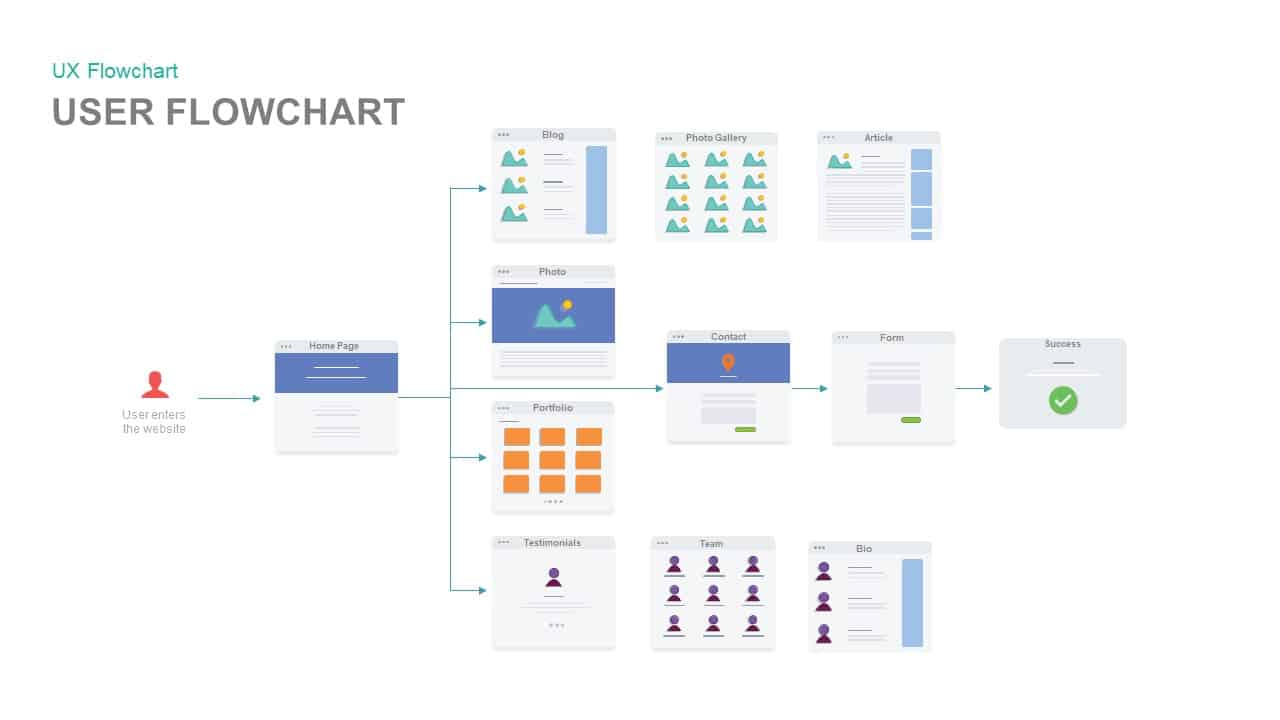
The benefit of flowcharts is that they display the activities involved in a project including the decision points, parallel paths, branching loops as well as the entire sequence of processing through mapping the operational details within the vector value chain. When the chart is created, it displays the method that the organization uses to attain a particular objective of the project. This will make it easier for project managers to move through the process of determining, entrusting and scheduling each task to the team members.
PowerPoint flowcharts are more ideal for presenting project management processes than any diagrammatic representations. Use flow chart PowerPoint and keynote presentation as a template to start using flowcharts in your own projects.
Related Articles
-
 November 3rd, 2019
How to Create a Persuasive Business Plan for Your Startup ( Templates Included)
Presentation Skills -
 November 22nd, 2019
The 19 Best PowerPoint Templates of 2026
Presentation Skills -
 September 23rd, 2019
Effective Presentation Tips
Blog Post