
How to Present Data in PowerPoint Presentations Like a Pro


Data can be fascinating, but translating it into a captivating and clear presentation can be a challenge for many people. In this article, let’s explore some effective strategies which you can use to transform dry statistics into engaging visuals that inform, impress, and inspire your audience.
First, Know Your Audience.
Before you present data in your PowerPoint presentations, take some time to know your audience.
Use this knowledge to tailor your approach. Consider your audience’s level of data literacy and adjust the complexity of your data visualizations and explanations accordingly.
Remember, don’t just present data. Try to tell a story using it. What I mean is, highlight trends, relationships and insights based on your data. This makes your presentation resonate better with your audience.
Choose the Right Chart.
When you’re presenting data in your PowerPoint presentations, don’t force a specific chart type. The data should dictate the most effective visual representation. Each type of charts are best at different things. Pie charts are great for proportions, bar charts for comparisons, and line charts for trends.
It Does Not Have to Be Boring:
You can even choose to go beyond basic charts. Feel free to explore infographics, data maps, and even interactive charts to make your data visually compelling and easier to understand.
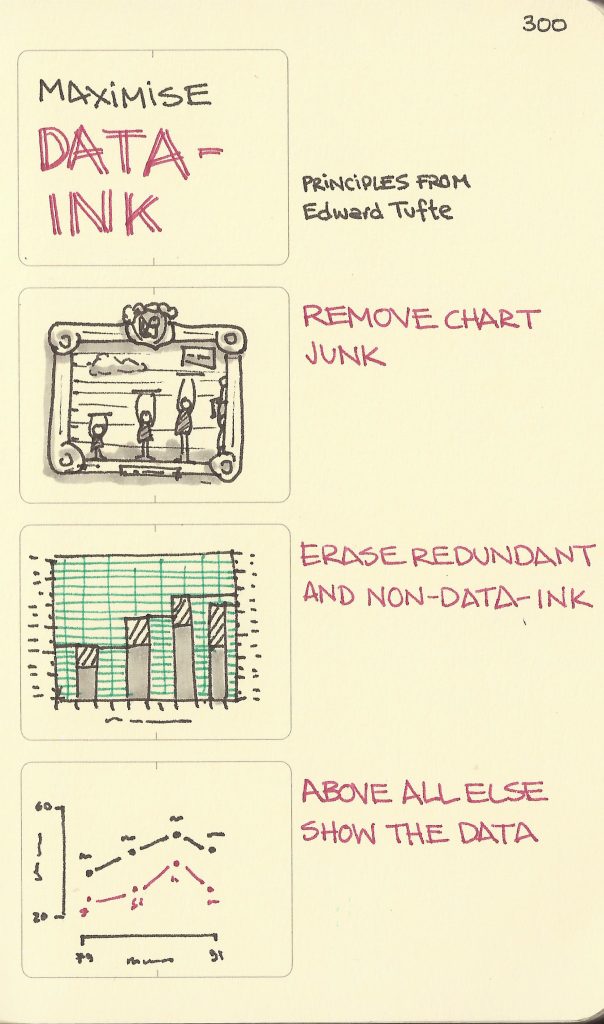
Another thing you can try is using colors. You can use colors strategically to highlight key points. But be sure to avoid flashy color palettes, which can be distracting and off-putting, especially in professional presentations. In such cases, make sure you stick to the same color palette as your presentation. Also, here’s a sketch by Sketchplanations that’s relevant:
You can also add data labels, callouts, and trendlines to guide your audience’s eye and emphasize key takeaways.
How to Copy and Paste Charts from Excel:
When copying charts from Excel, you have the following options:
Link or embed: Link allows you to link the chart to the original excel file, and this automatically updates your charts whenever the values in the Excel file changes. You can also embed it, which adds it as a static image, completely independent from the Excel file.
When you right click the chart in Excel, choose Copy Chart and then in PowerPoint, right click and paste as per your preference.
Focus on Clarity and Conciseness:
Always use clear labels and titles. This ensures that your charts are easy to understand without referring back to your explanations. This also helps prevent you yourself from being confused when you’re delivering your presentation.
Limit text on slides that have charts. Opt for concise headings, bullets, and annotations instead of lengthy paragraphs.
Prioritize key insights and don’t overwhelm your audience with every data point; focus on the most significant findings and conclusions.
While presenting data you can also engage your audience. Here are a few tips:
Include interactive elements in your presentations. Utilize interactive features like hover effects or animation to add dynamism and encourage exploration.
You can also ask questions and invite your audience to engage with your data by posing thought-provoking questions and encouraging discussion.
Remember to always provide context. Explain the data’s source, methodology, and limitations to build trust and transparency.
Bonus Tips:
Don’t clutter your slides; allow visuals and data to have breathing room for better impact.
It’s easy to overload charts with too much data, and too many confusing labels. As with most things related to presentations, less is often more.
By following the tips and strategies mentioned above, you can ensure that whenever you need to present data in your presentations, you do it well. Ultimately, its your presentation skills that can unlock the true potential of your presentations. So don’t forget to practice well in advance! Good luck on your presentation!
Related Articles
-
 October 16th, 2025
Map Career Growth for Presentation Designers (Before Your Best People Leave)
Blog Post -
 June 15th, 2023
Best Add-ins for PowerPoint That You Can Use to Create Timelines
Blog Post -
 September 16th, 2025
From Blank Slide to First Draft in 30 Minutes: An AI Workflow for Presentation Teams
Blog Post