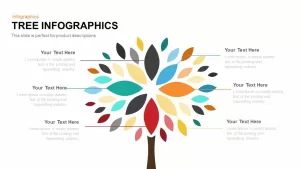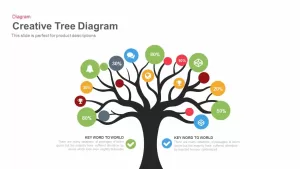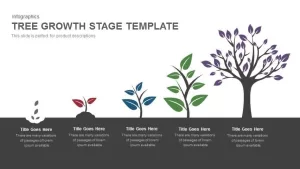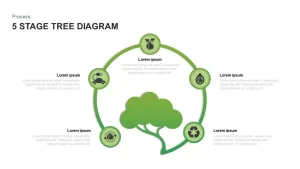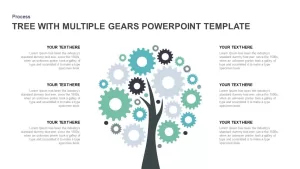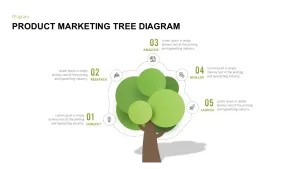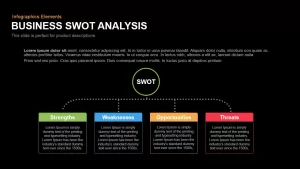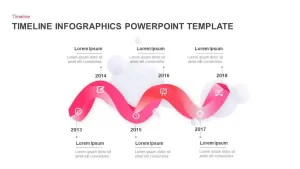
Tree infographics with analysis PowerPoint template and Keynote slide the slide is created with a tree in a silhouette tress forms with analysis which can be used to show your product analysis report. The template is created with a hexagon with a number along with it. The slide is created in both keynote and PowerPoint.
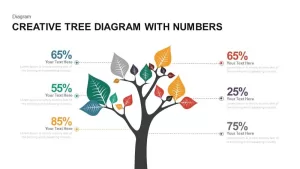
Tree infographics with analysis PowerPoint template and Keynote slide is a pre-designed slide mostly suitable to display business development, market network, business analysis, sales report, and the ecosystem. The PowerPoint SmartArt is fully edible vectors that can be capitalized for varying needs. The tree diagram shows the percentages of sales or growth instead of leaves. Business managers can illustrate the existing conditions of the company through sales data, revenue, expenses, estimated budget allocations, current financial positions, etc. The graphics are relative to the characterization of environmental protection; the gray and deciduous nature metaphorically indicates global warming and the water scarcity crisis. Hence, the interdisciplinary tree diagram PowerPoint template is ideal for any kind of presentation.
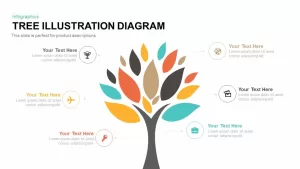
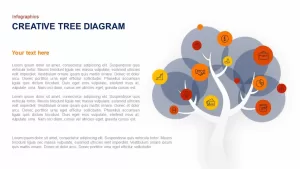
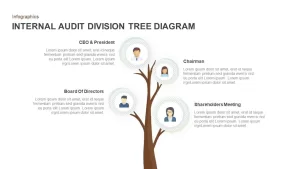
The tree analysis diagram for PowerPoint & keynote is a unique template that can be combined impeccably to signify central concepts in a business presentation or use visual graphics to ornament the design. The PowerPoint has too many symbolic illustrations. The design shows the root of the tree symbolizes the foundation of a business enterprise. Users can use this style to depict the key foundation process of the organization and the major pillars of any business. That may be the core values or the desired goals.
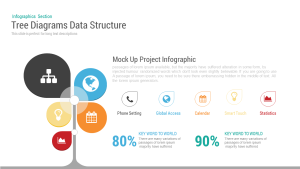
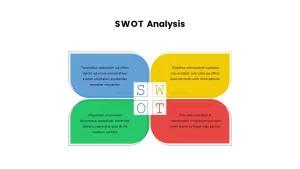
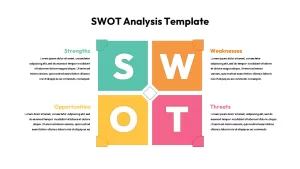
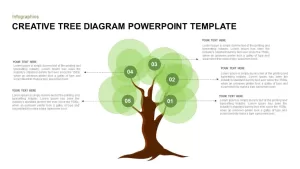
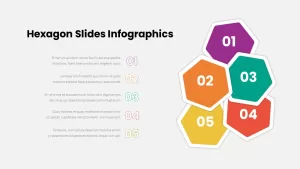
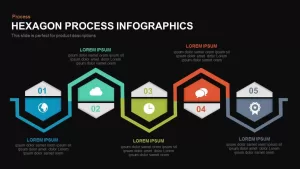
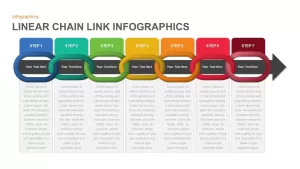
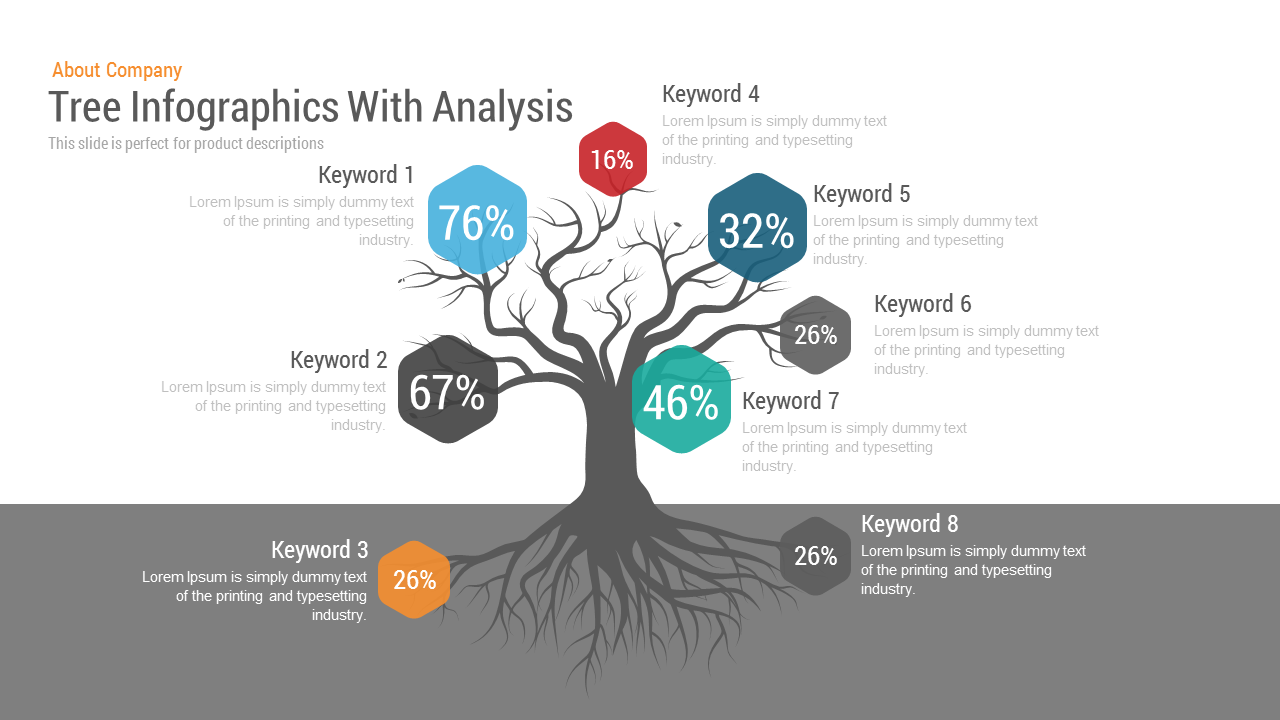
The infographic tree diagram with business analysis was created with a classical tree layout that can be fully customizable. The hexagon shape placeholders have different colors, and each has its own text areas. The user can use these text areas to write the important topics of the presentation. Each hexagon placeholder shows varying values. Users can change the percentage numbers and replace infographic icons instead of these numbers. Eight key topics of the presentation can be shared with the audience. The color pallet and the font sizes are also changeable in accordance with the style and tone of the interaction. Users can download more tree diagrams from our gallery to impress the viewers.