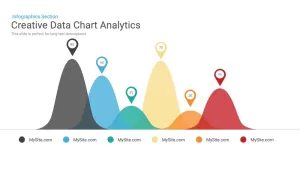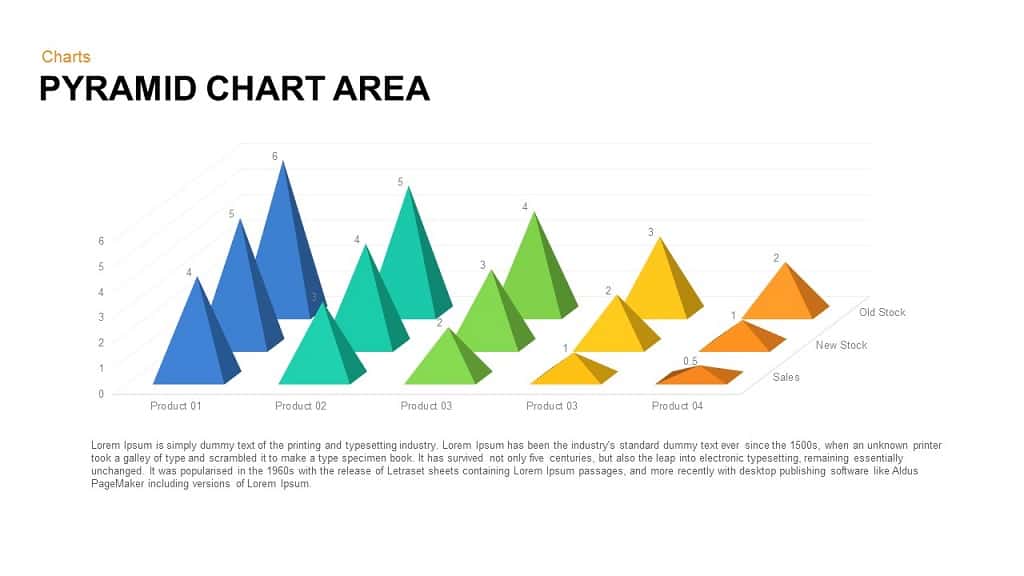
Pyramid Area Chart PowerPoint Template
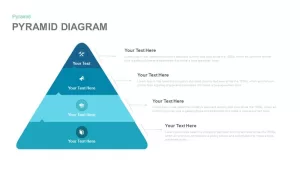
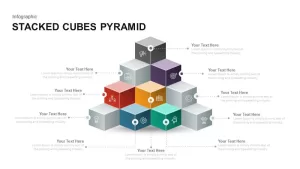
Plotting of values in a graph may be part of the usual lengthy arithmetic operation. But with our Pyramid area chart PowerPoint template, an entertaining factor can be found while graphing the values in the presentation. In Egyptian culture, the pyramid is examined as a strange. But in current time, the pyramid has evolved to be a crucial PowerPoint shape. Pyramid chart template is an effective tool for modeling a relationship between quantitative and qualitative data. Pyramid can show hierarchical, interconnected or proportional relationships. Pyramid chart can display statistical data like never before. Usual charts or graphs use bars, arrows, cylinders. But instead of typical designs Slidebazaar has added pyramid to make the template standout and can grasp the maximum light as possible. The pyramid chart template creates a non-intimidating atmosphere in the meeting which enables the audience to interact and to retain the report quickly.
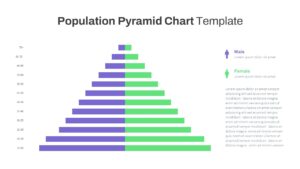
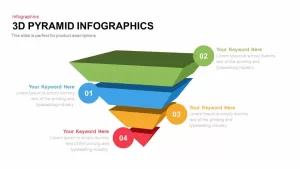
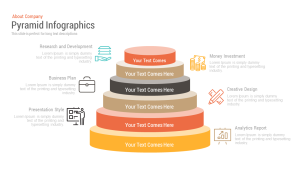
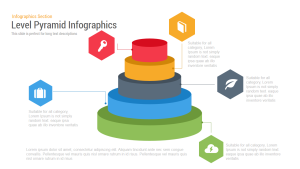
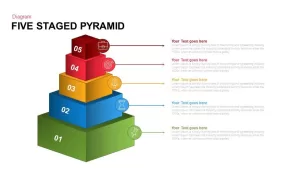
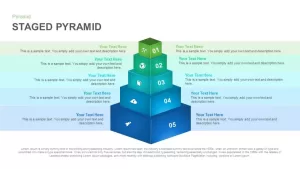
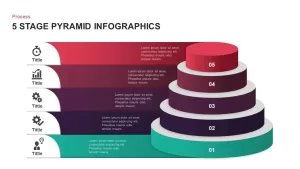
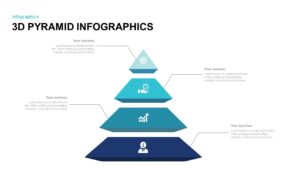
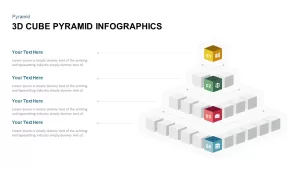
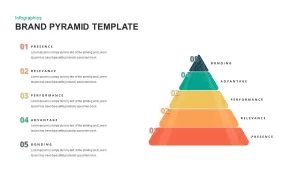
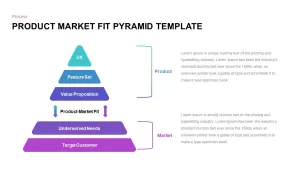
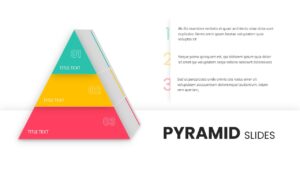
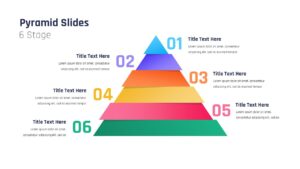
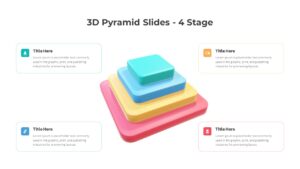
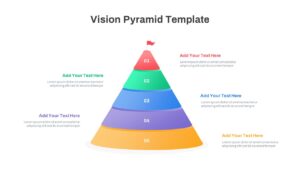
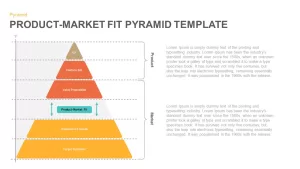
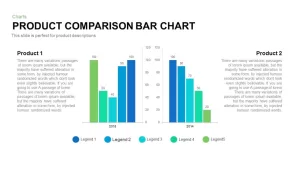
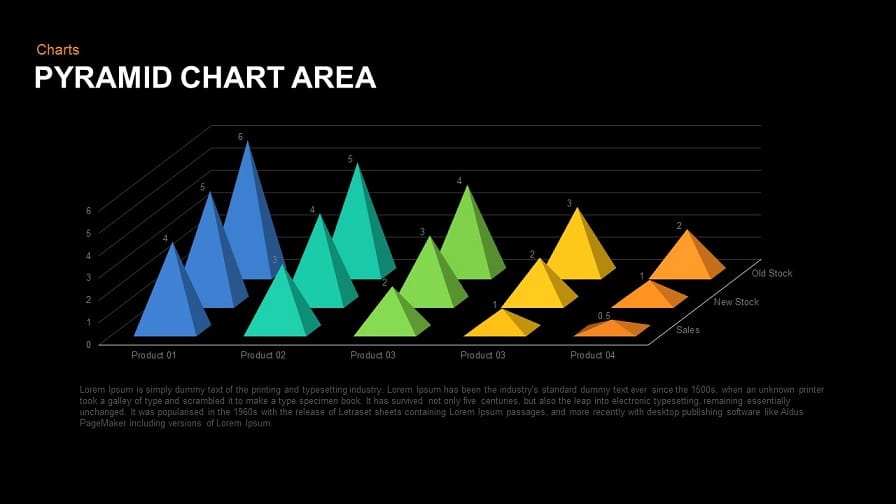
Our pyramid area chart template is ideal for comparing three products, services, values. The presenter can make five comparisons at a time, the tip of the pyramid marks, the bottom of the pyramid occupies more space, so it enables the audience to differentiate the analysis easily. The design of a pyramid chart area template is one of a kind and will surely encourage the audience to pay focus on statistical data. The design strikes the mind of the audience which turns it out to be a remarkable experience. The pyramids are arranged in a way that it adds a virtual effect to the template. Bottom of the template is combined with text areas where the presenter can add a brief description of the presentation. The template is crafted using PowerPoint shapes, so customizations of the template can be done in few clicks. The rich color scheme gives an artistic touch to the template. The noticeable color scheme allows the audience to remembers the facts and data. The presenter can perform market analysis, competitor’s analysis, product comparisons, etc. Now present your data and create catchy reports using our pyramid chart area template.