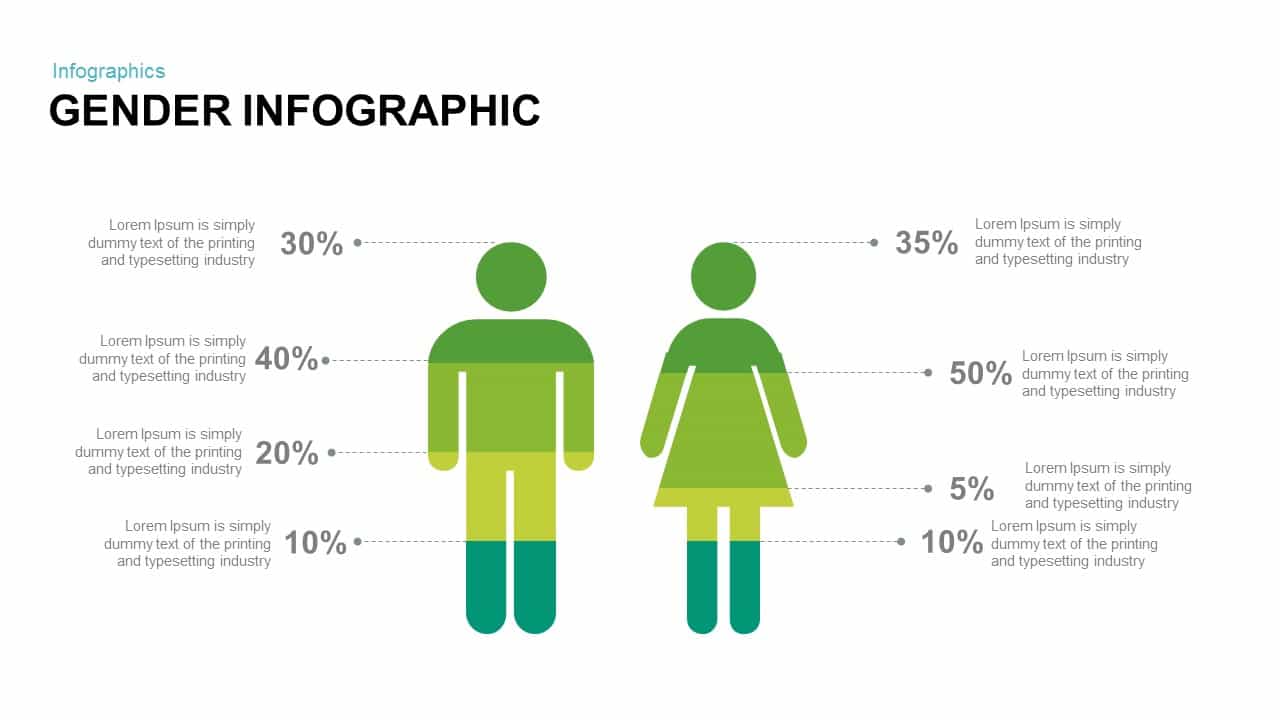
Gender Infographics PowerPoint Template
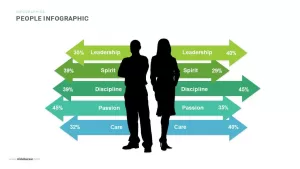
To show the connection between gender and business, use our infographic gender PowerPoint template and keynote. Gender based marketing is an essential strategy to sell your fast moving consumer goods. Every FMCG companies have already developed such strategies to enhance their sales volumes and company revenue. The market segmentation based on sex composition is a reality. So the presenter from FMCG marketing can download this diagram to show the relevance of gender marketing in today’s world. Apart from business and marketing, gender infographic PowerPoint template will be useful slide for academic teaching based on gender discrimination and gender equality.
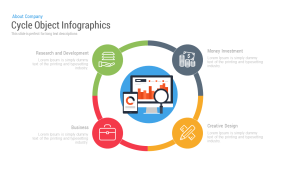
Infographic gender PowerPoint template and keynote is a creative tool in making a comprehensive presentation of global market segmentation based on gender and its distribution. The layout is based on the role of market segmentation in business development in order to demand the product. Fast moving consumer product marketers drive sales by developing varieties of products according to the sex ratio and age composition; these demographic features has an immense influence on demand and supply. Gender identified products reinforce familiarity among the two market segments. Market segmentation is more frequently used in product campaigns and packaging. The products are basically the same but with different wrapping and advertisements directed towards the different demographic audience, though both males and females can come under the target for a given product it is also possible that the share of female may surpass the share of a male in the company’s target market. Under gender segmentation, the databank is divided into male or female.
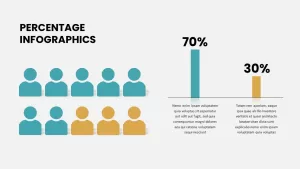
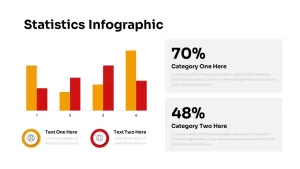
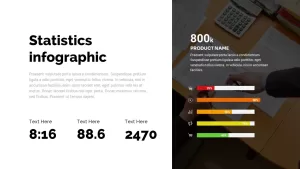
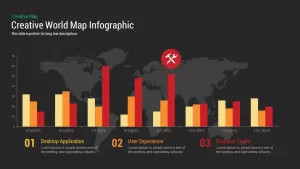
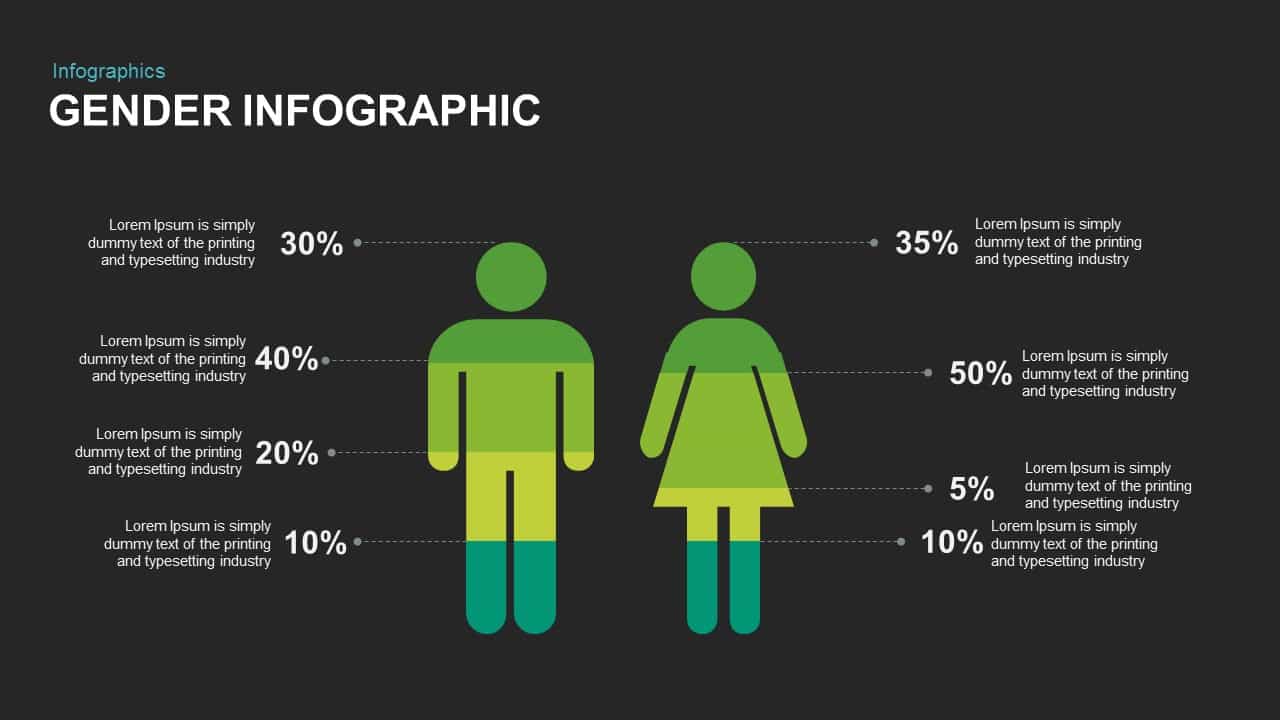
This gender PowerPoint template can be used to display the segmented distribution according to the gender or demographic statistics, diagrams show the percentage wise usability of a product. Ideally, this illustration also explains everything about a certain promotion or campaign. Light and dark color combination and the text zones help to distinguish information, and overall outlook may change with few clicks in PowerPoint menu
You can access more Free PowerPoint Templates here Grab the free ppt now!