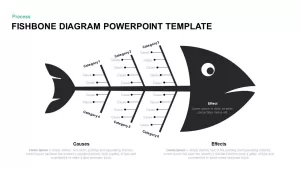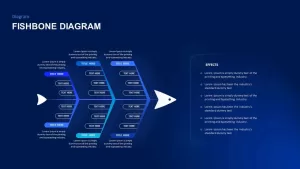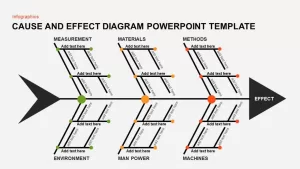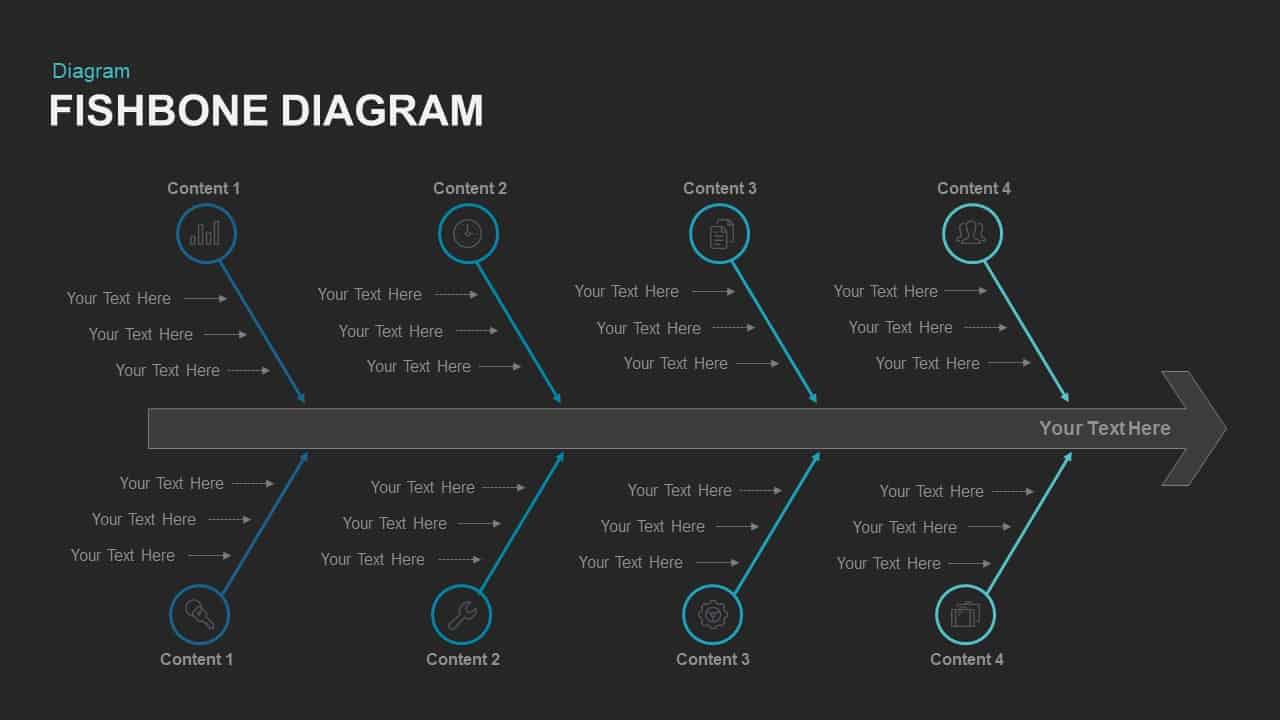
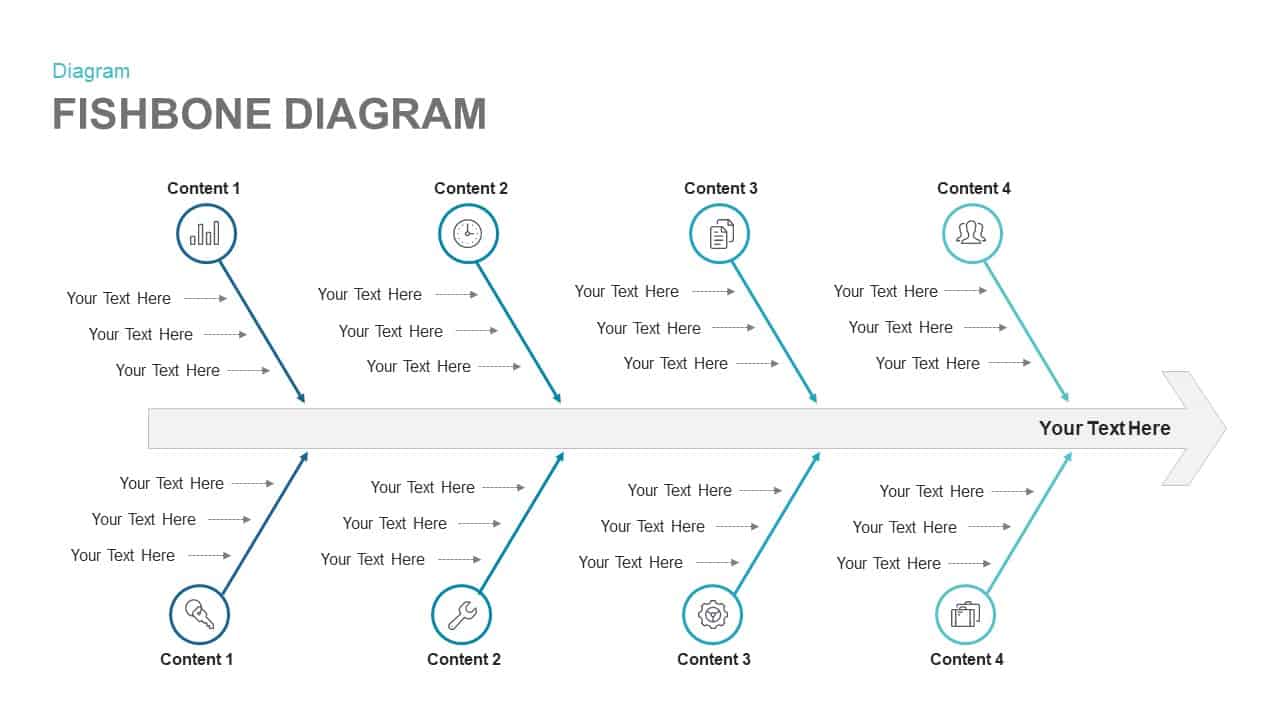
Fishbone Diagram Template for PowerPoint
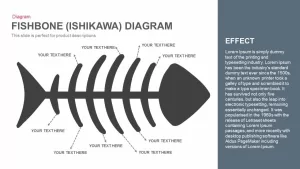
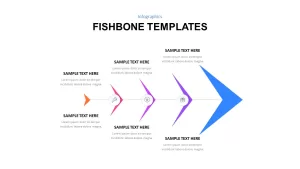
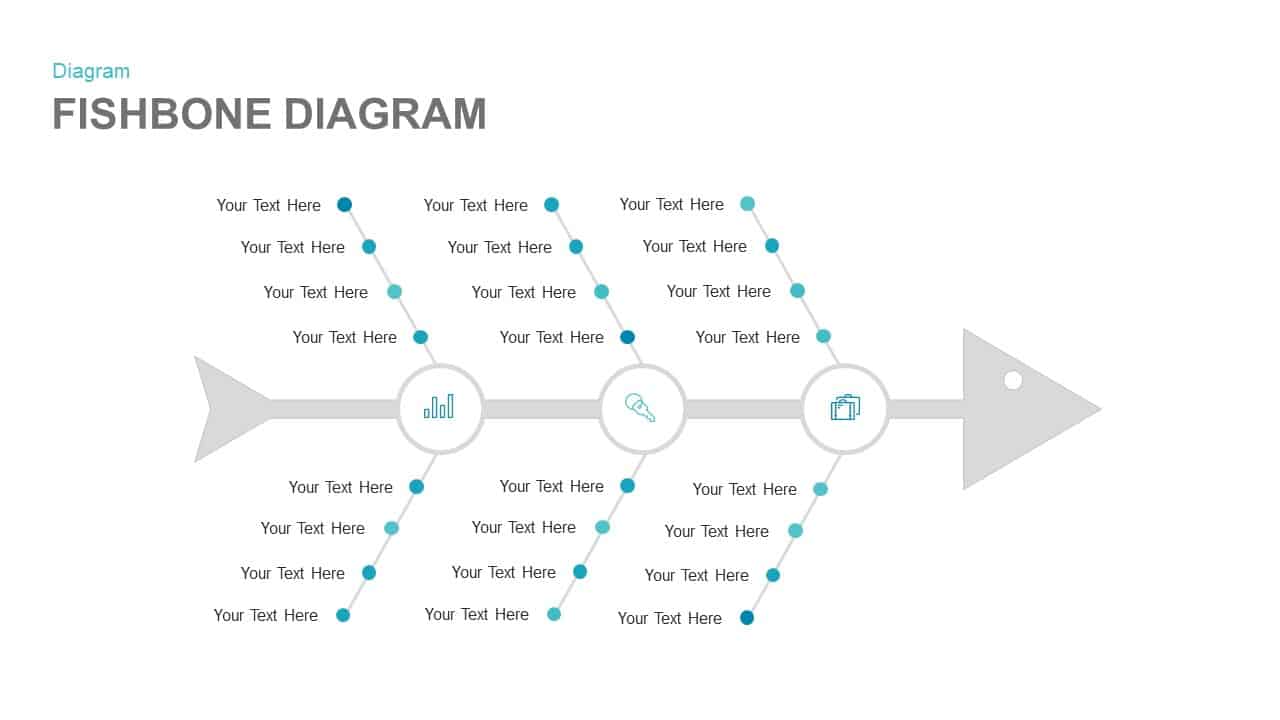
Fishbone diagram or Ishikawa diagram is useful for source analysis of an event or a phenomenon, which will explain the causal relationship between two or more variables. This fishbone diagram template PowerPoint keynote is designed like a fish with a head, bones, and spine. Each bone figuratively reveals the causes and is classified in order. The head of the fish indicates the effect of these various causes is interrelated and interdependent. This Fishbone diagram template PowerPoint keynote can be useful to identify many different causes behind an effect. If we find out the root and result relationship of any issue or problem that will become a theory. This is the in-depth knowledge of the activity and makes an accurate understanding of the factors that triggered an effect.
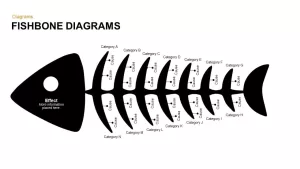
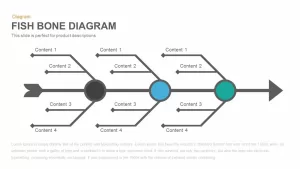
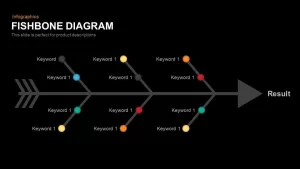
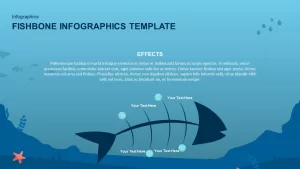
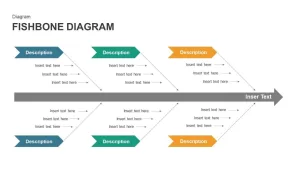
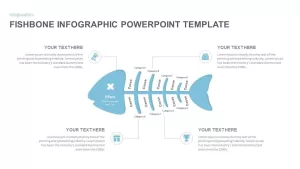
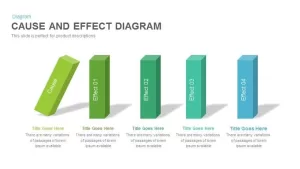
To present cause and effect relationship of concepts or variables; fishbone PowerPoint templates are ideal ones. This diagram design is used to identify the facts behind a phenomenon. Here the user can explain different causes and their possibilities to create an effect; the cause and effect relationship between a product and consumer attitude can be analyzed and verified through this three-layered fishbone template. They are generally used in post mortem activities in order to understand which were the factors that produced an effect. The structure of the diagram consists of the head, bone, and spine. This is for scientific and technically sounded professional presenters. The user can select the fishbone diagram PowerPoint template and keynote slide for a more complex data presentation from our gallery with detailed descriptions. This simple fishbone diagram example is a powerful tool for the engaging audience and creates quality discussions about problems and their roots. The diagram is also called the Ishikawa diagram you can get more diagrams here. The diagram allows editable properties, so the user can make modifications and alterations as per their requirements.
You can also check out our fishbone powerpoint template keynote diagram, fishbone timeline template, free fishbone diagram PowerPoint template and fishbone diagram powerpoint template