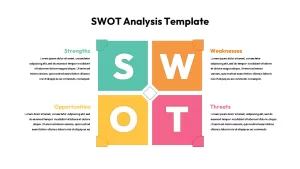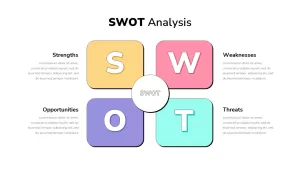
E-Learning Report Analysis Template for PowerPoint and Keynote
E-Learning report analysis template for PowerPoint and keynote is a unique one in the arena of data analysis template. After the invention of computer and internet, so many new “words and worlds” has been emerged. We have frequently encountered the words like e-business, e-governance, e-shopping, e-commerce, e-learning and son. Nearly all have gone electronic, while few years ago the World Wide Web was considered a privilege, today it is an inevitability. E-learning is a leaning by utilizing the electronic media and devices. It is often called virtual learning. E-learning metaphor for PowerPoint presentation can be used to display the data related e-learning courses and the people engaged in virtual learning network. It can also use to emphasize the power of electronic Media to transform the conventional mode of the education system. Today anyone can obtain education anywhere, anytime through online education. This education PowerPoint may use to display the increase of e-learners over the period.
E-Learning report analysis template shows the data of individuals they use the e-learning portals to increase their knowledge and ability. For example, the numbers of users of e-library giant Wikipedia has been growing rapidly by every year. Similarly, other online learning and education providers and academic researchers can use this report analysis diagram to display the increase in the virtual learning space. The users can use this editable PowerPoint template with or without making changes.
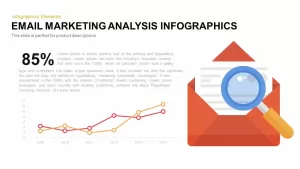
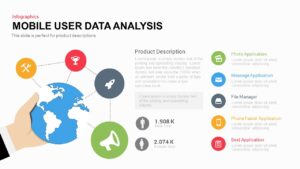
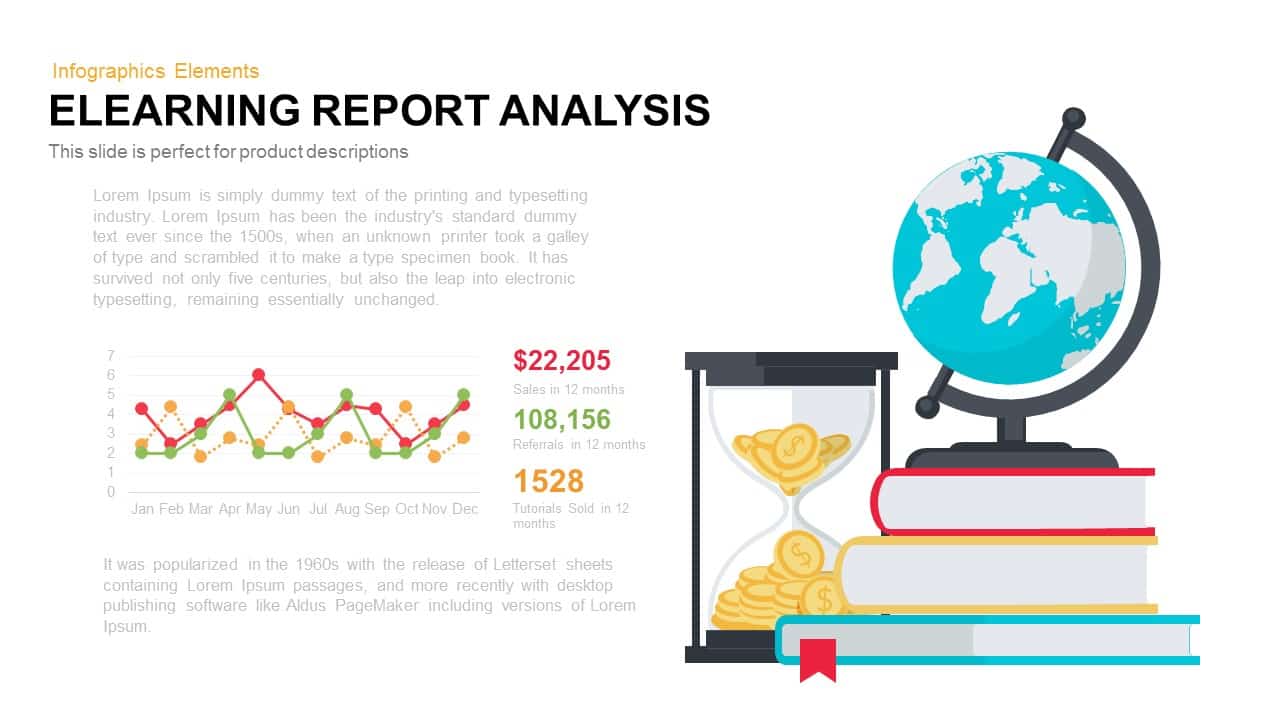
E-Learning Report Analysis template is a slide with good design and imagery showcasing books, a globe, currency and a graph. ELearning is learning or attaining an education with the help of the internet either on your own or with the help of your tutors. There are several web-based courses which are taken up by students on a self-learning basis to save time and money. This slide on eLearning Report Analysis can be used to show the reports of analysis, statistics, demographics, ratio or percentage of students engaged in various courses online or the like. You can edit and add in the relevant text next to the image; including this slide in your presentation will surely make your audience more attentive and intuitive with the colors and the illustration. The Slide is designed in both PowerPoint and keynote in both the aspect ratios 4:3 (Normal) and 16:9 (widescreen).