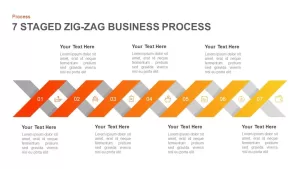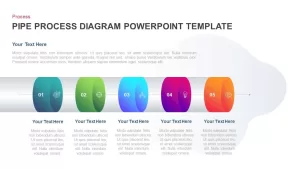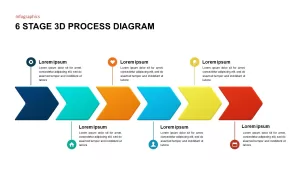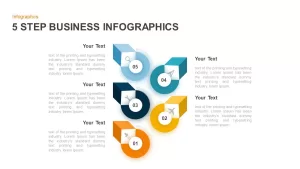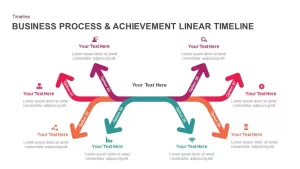
Business Process Diagram Infographic Template for PowerPoint and Keynote
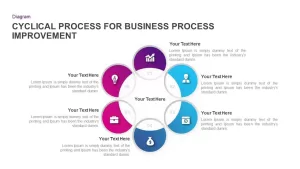
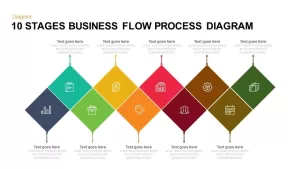
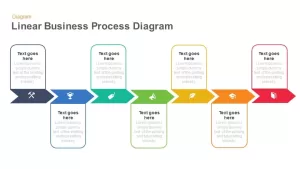
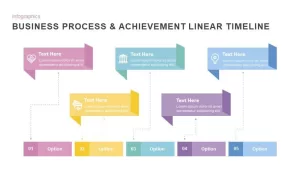
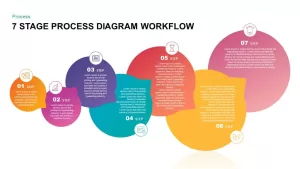
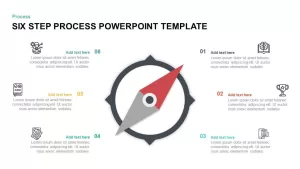
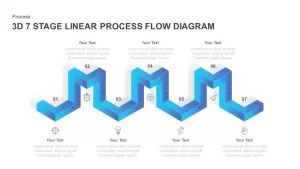
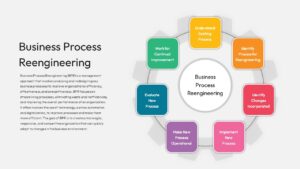
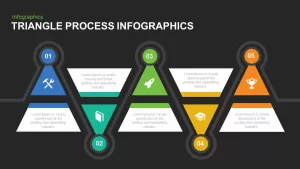
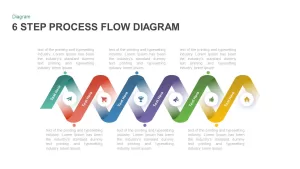
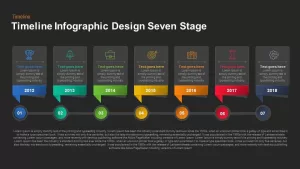
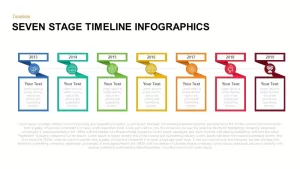
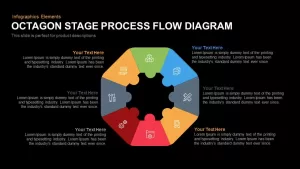
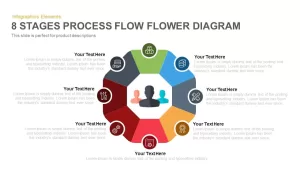
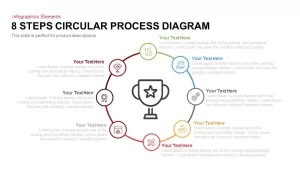
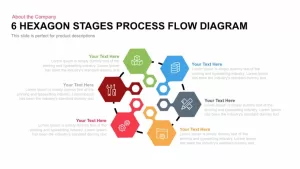
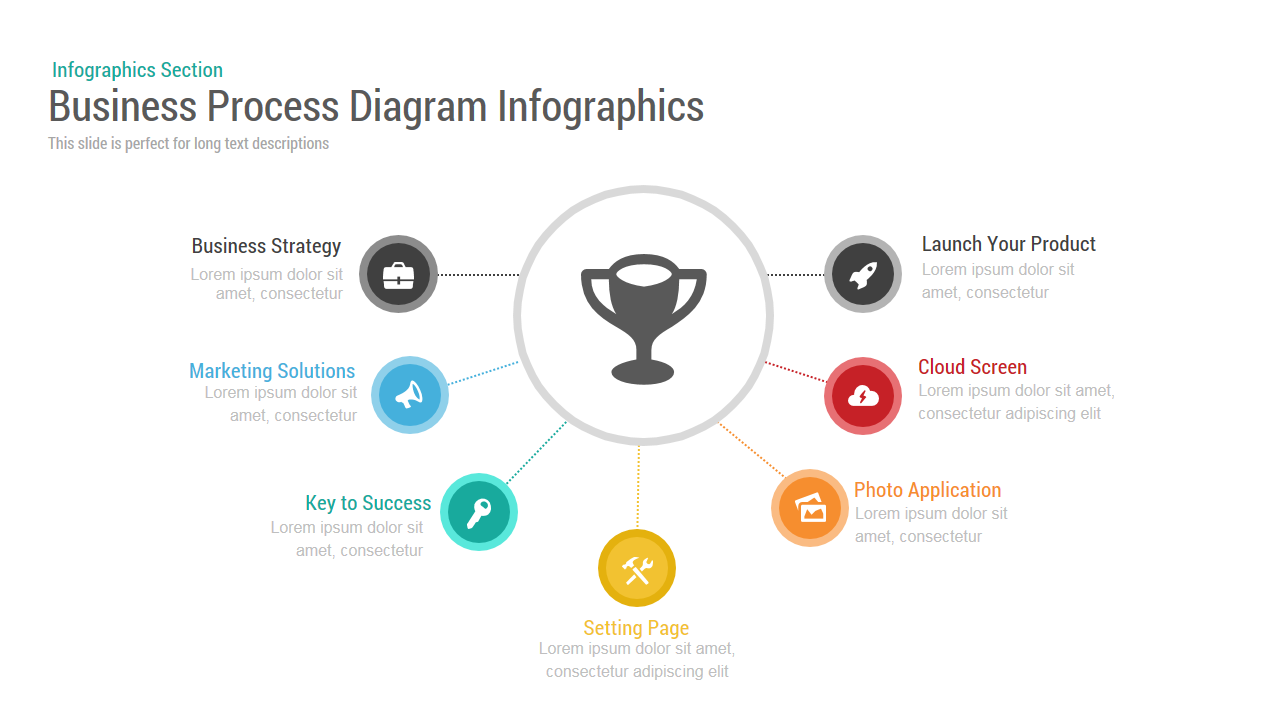
Business process diagram infographic template for PowerPoint and keynote with 7 sections or segments which you can easily represent your services and process, stages, etc.
The template is designed in both PowerPoint and keynote versions in 16:9(widescreen) and 4:3(Normal) Version.
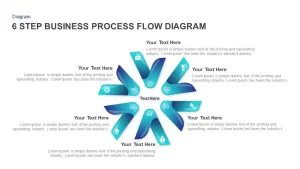
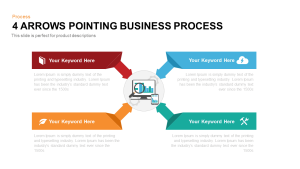
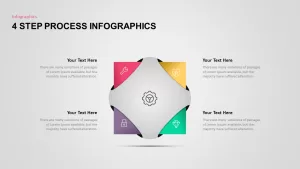
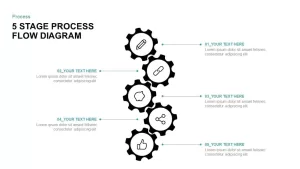
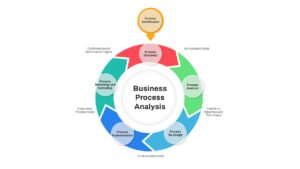
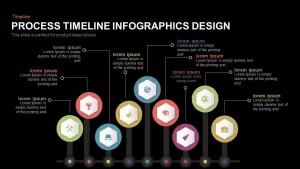
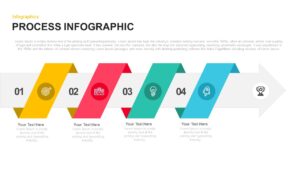
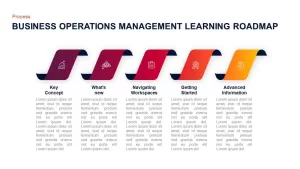
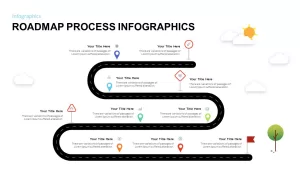
Showcase a vibrant workflow presentation using the business process diagram infographic template for PowerPoint and keynote. This creative PowerPoint template is highly usable in the process and stages of presentation. Process flow diagrams are an important business tool in showcasing complicated procedures and steps. This template is perfect for scheduling works for the team members; there are a lot of settings and options in workforce operations that can cause conflicting results. There are also operation procedures that need to be followed by a lot of people in the business enterprise. Users can delivered newly formulated procedures, after a detailed study of the working characters and avoid choosing the wrong steps.
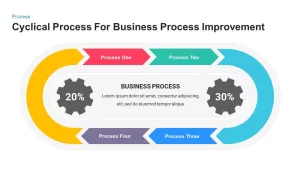
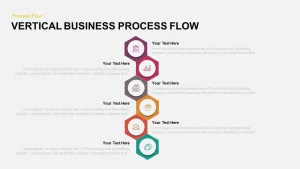
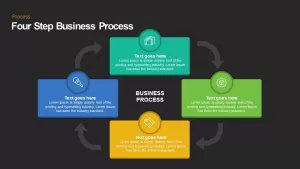
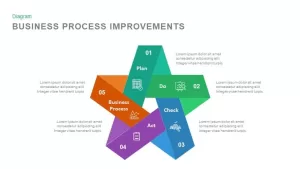
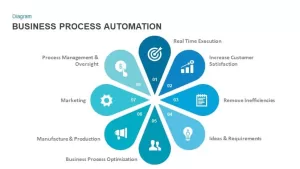
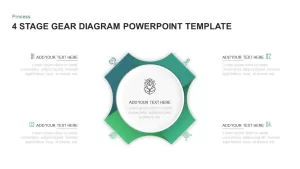
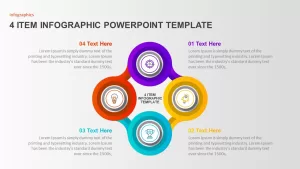
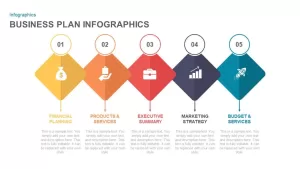
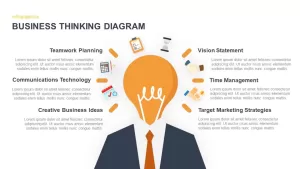
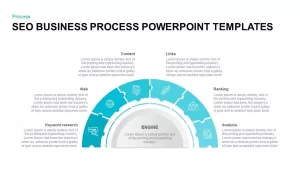
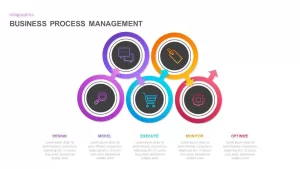
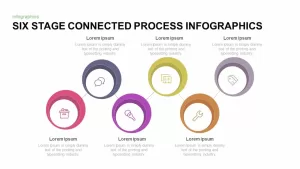
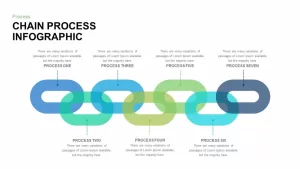
This design and look are perfect for business process management presentations. Business process management is a term that denotes any combination of modeling, execution, automation, control, optimization, and measurement of business activity flows, in support of enterprise goals, bridging systems, employees, customers, and stakeholders within and beyond the organization frontiers. Business process means a flow of activities and seeing those activities as connected toward the achievement of some business transaction. This PowerPoint can use to delineate the different processes within an element and display the improvement strategies and steps. Business managers and professionals can use the possibilities of the diagram to show seven processes of product development and implementation.
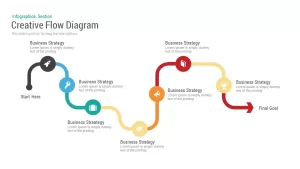
Business process diagram infographic template for PowerPoint and keynote can be used for a variety of showcases. The minimal style and easy understanding layout definitely catch the attention of the audience. Users can mobilize the meaning of infographic icons as the presentation needs. At a glance, the design stresses the goal-oriented mode of displays because the overall look is decorated by the trophy in the center. Business organizations have definite vision and goals, presenters can illustrate seven concepts of how to reach the desired goal; the goal may be sales promotion, new product development, enhance the skill of the workforce and alike. Each section with different color codes enables the accessibility of users on the presentation theme. The presenter can download process and circular diagrams from the slidebazaar gallery and make unique displays.