


Before and after powerpoint template
Description
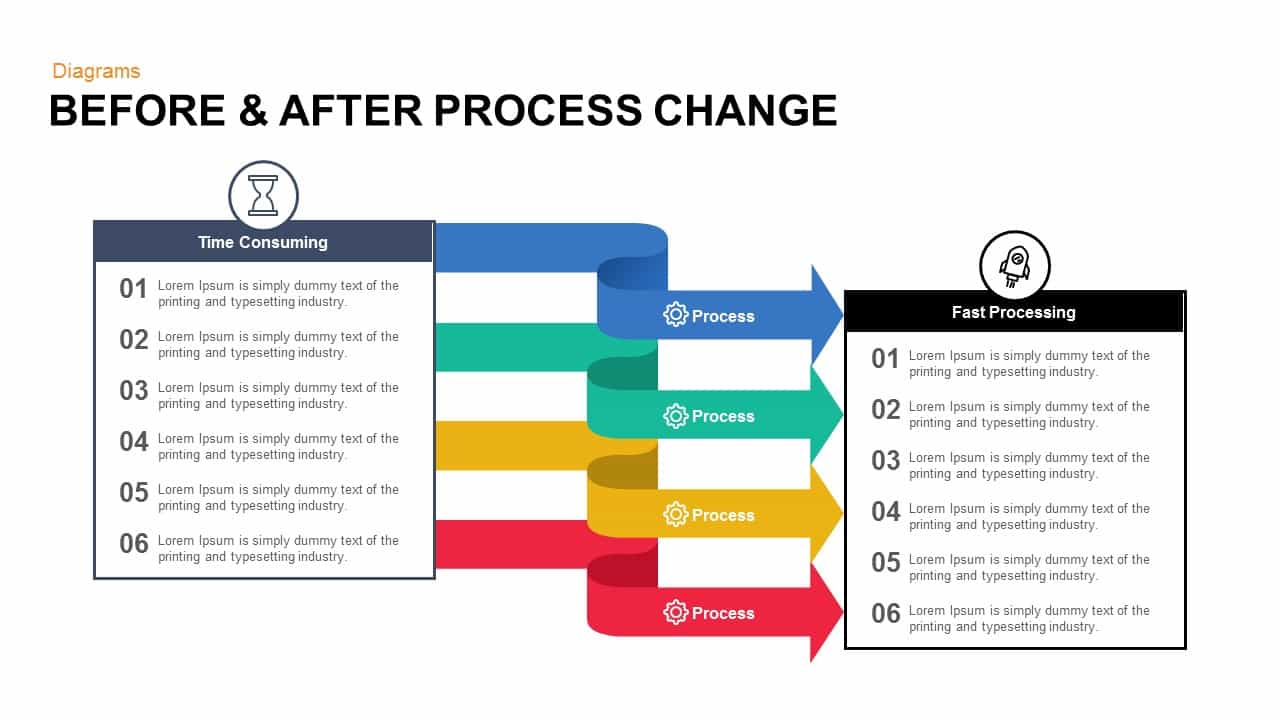
This "Before & After Process Change" diagram effectively highlights the transformation of a process from a time-consuming model to a more efficient, fast-processing approach. On the left side of the slide, the "Time Consuming" section presents a series of steps, with each step corresponding to a process in the original workflow. The right side features the "Fast Processing" section, where the same processes are streamlined and visually enhanced to show the improvements made.
Each section is color-coded with distinct arrows and process labels to emphasize the contrast between the old and new workflows. The clean design ensures the information is easy to follow, while the vibrant colors (blue, green, yellow, and red) add visual appeal to each step. This slide is ideal for illustrating process optimizations, workflow improvements, or project development transformations.
Fully customizable, this diagram allows you to insert specific content and data into each process box, making it adaptable for a variety of business applications, including process reengineering, workflow analysis, and project management. It's compatible with both PowerPoint and Google Slides, ensuring smooth editing and presentation across platforms.
Who is it for
Business analysts, process managers, operations professionals, and project leaders will find this slide useful for visualizing process improvements. It’s also ideal for any team involved in workflow optimization, performance improvement, or transformation projects.
Other Uses
Beyond process optimization, this diagram can be used to demonstrate the impact of new tools, methodologies, or systems on operational efficiency. It can also be repurposed for before-and-after comparisons in other fields such as customer service, software development, or marketing campaigns.
Login to download this file

Item ID
SB00813