


Operational Excellence PowerPoint Template section
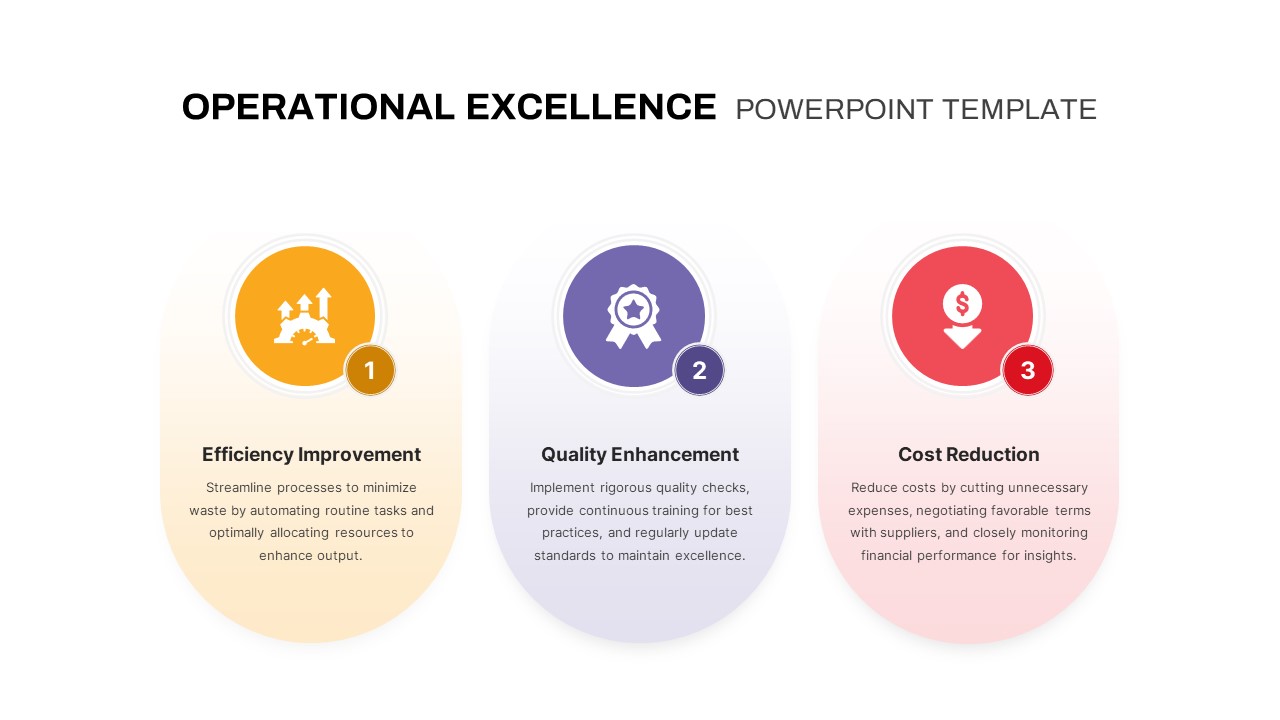
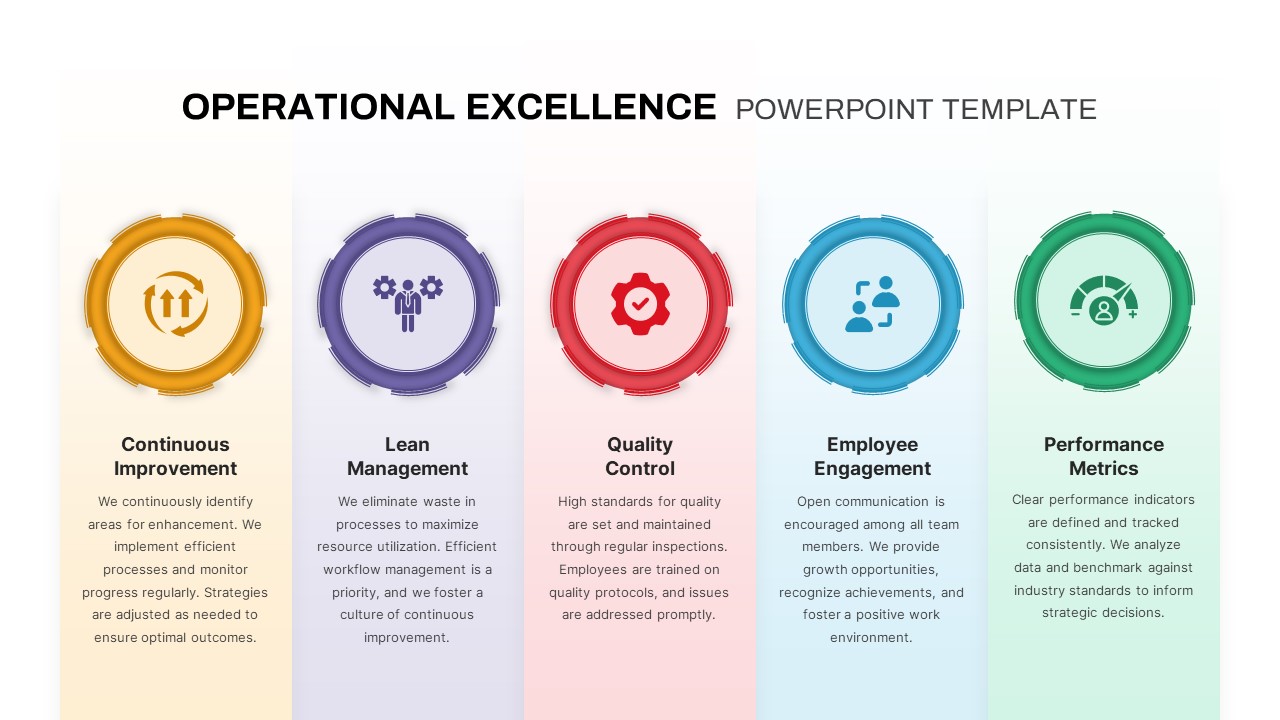
This operational excellence framework template provides versatile infographic layouts to communicate key process improvement pillars and strategic initiatives. The master slide deck includes three distinct slide types: a five-pillar vertical infographic with gradient-colored panels and circular icons for Continuous Improvement, Lean Management, Quality Control, Employee Engagement, and Performance Metrics; a six-step circular diagram with icon-driven segments highlighting Sustainability, Technology Integration, Customer Focus, Employee Engagement, Process Optimization, and Quality Management; and a three-phase process slide featuring streamlined gradient panels for Efficiency Improvement, Quality Enhancement, and Cost Reduction.
All slides leverage modern gradients and vibrant accent hues set on a clean white background. Vector-based icons and consistent sans-serif typography ensure clarity and professionalism. Master slides support full customization—swap icons, adjust gradient swatches, update text content, or recolor segments via PowerPoint or Google Slides theme settings. Preconfigured placeholders maintain alignment and spacing, while subtle drop shadows and rounded shapes add depth without clutter. This cohesive design system empowers teams to rapidly assemble presentations, ensuring brand consistency and eliminating formatting issues across platforms.
Further slide variants include title and section-break layouts that seamlessly integrate with the infographics, providing clear transitions and consistent branding. The fully editable legend and icon library on the slide master enable you to maintain visual coherence, while vector shapes guarantee high-resolution output on any display or print medium. Whether you are presenting process-optimization roadmaps, performance-metric dashboards, or team-engagement strategies, this template’s flexible design adapts to diverse operational themes and industry contexts.
Who is it for
Operations managers, process-improvement leaders, quality auditors, and corporate trainers will leverage these infographic slides to present frameworks, best practices, and performance benchmarks in workshops, board meetings, and client engagements.
Other Uses
Use these layouts for Six Sigma project summaries, continuous-improvement proposals, performance dashboard integrations, change-management strategies, and cross-departmental communications requiring clear, data-driven visuals.
Login to download this file

Item ID
SB04285