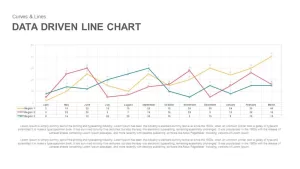
Weekly Data Charts PowerPoint Presentation Template
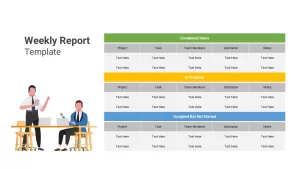
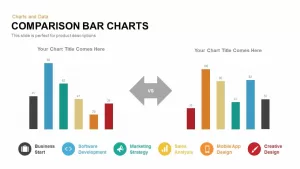
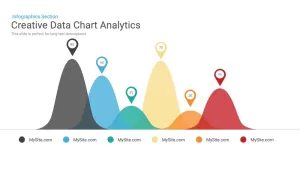
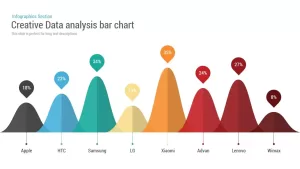
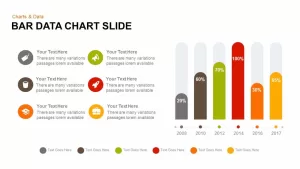
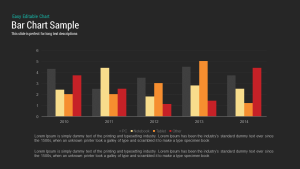
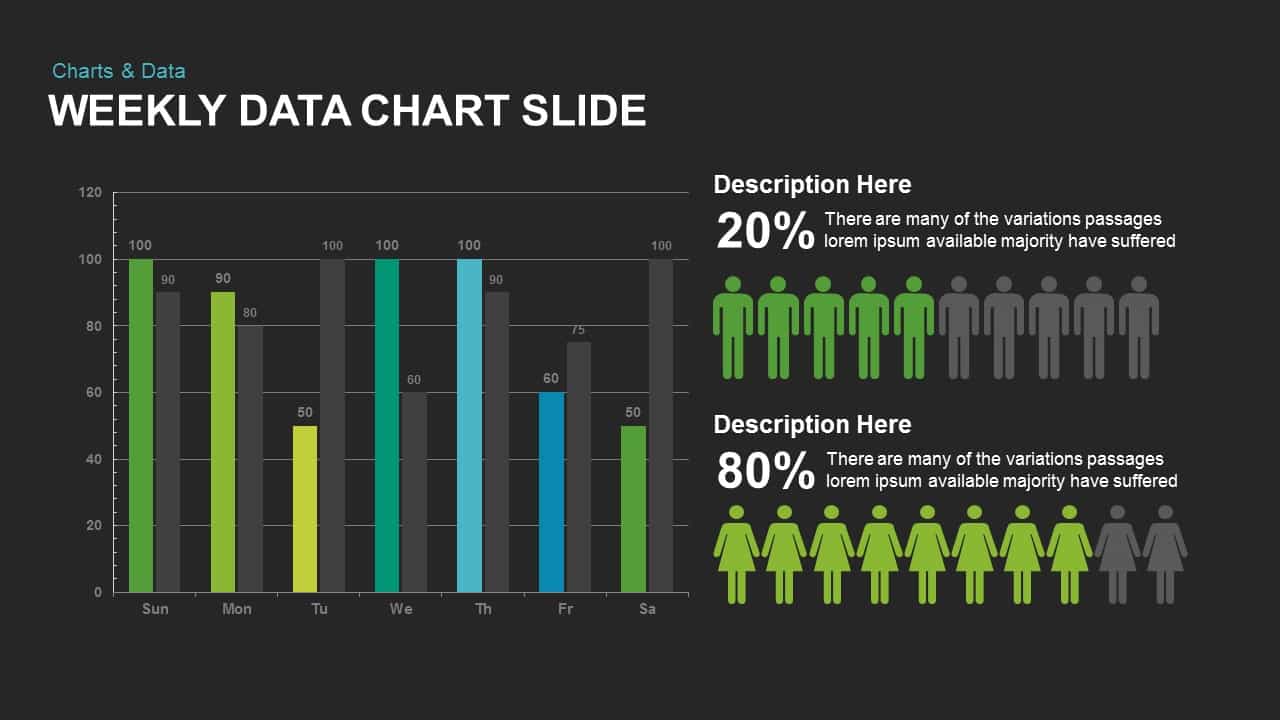
Dashboards are an important tool to display business data or marketing data in a global market range. Here the weekly data charts PowerPoint presentation template and keynote slide is useful to show your weekly or monthly sales or other data through a bar chart. The percentage of sales volumes and distribution can be simply monitored using the data chart PowerPoint template. This PowerPoint is a creative and customizable bar graph created with PowerPoint shapes and data-driven PowerPoint charts. It is ideal for simple data presentation and impactful visual graphics. Typically, bar charts are a simple and powerful representation of data. Each bar represents a value or series. The template is perfect for business research presentation and represents the demographic distribution of age and sex compositions. The cartoon illustration is perfect for the demographers and socio-economic researchers to show the population distribution of a country. Therefore this template is more useful for the scientists and policymakers to show the fundamentals of a country or a particular territory.
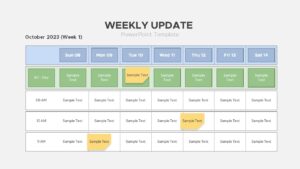
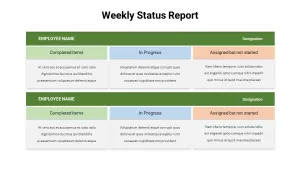
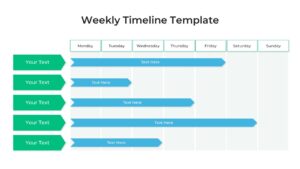
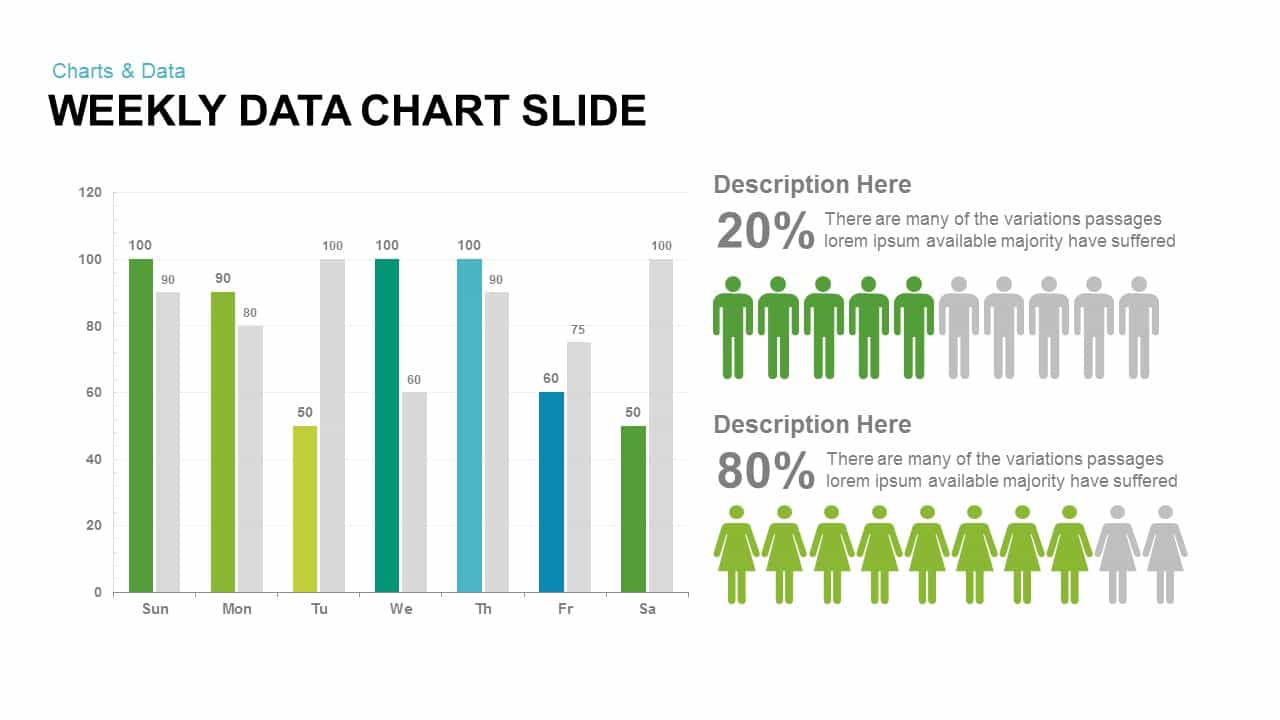
Weekly data charts PowerPoint presentation template and Keynote Slide with People Performance. A chart is a graphical representation of data. Charts allow the users to better understand the outcomes of data and prognosticate the present and future. The data is represented using so many graphical illustrations, such as line charts, bar charts, pie charts, candlestick charts, histograms, etc. Our weekly data charts PowerPoint presentation template and keynote slide designed is a simple bar chart which is useful to show weekly sales or price movement of a given product or the weekly progress of equity can be displayed in this beautifully designed data chart template. The spaces provided for descriptions and colour codes enable the viewer to access the presentation smoothly. The presenter can download clustered column chart PowerPoint and keynote template from our gallery for another statistical presentation that needs a universal character.
You can access more Chart PowerPoint Templates & fact sheet templates here Grab the free ppt now!