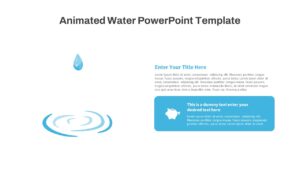
Water flow Infographics PowerPoint Template and Keynote Slide
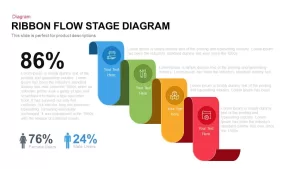
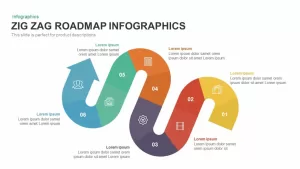
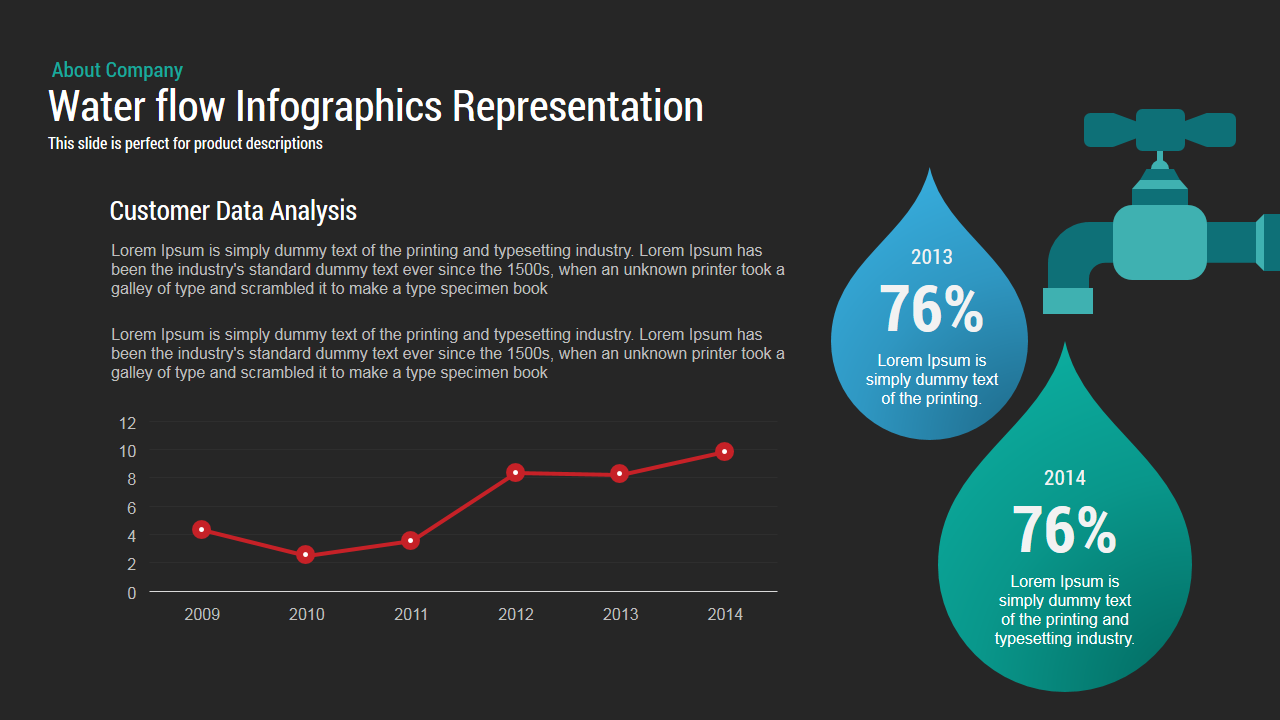
Water flow Infographics Powerpoint Template and Keynote slide which show the water drop with percentage data on a water drop also with a line chart across the years.
The template is designed in both powerpoint and keynote version in 16:9(widescreen) and 4:3(Normal) Version.
Water flow infographics PowerPoint template and keynote slide can be used for different fields like business, academic, water conservation, environmental protection, agriculture and so on. Water drops and the line graph shows the timeline development of a phenomenon or an event. Meteorological scientists and policymakers can display the availability and consumption of water resources and the amount of annual rainfall through the visual graphics.
Environmental sustainability is one of the core discussion topics among global communities. The concept of sustainability means that enough and enduring resources for everyone. Water is one of our precious resources, which should be handling judiciously and used efficiently. Many planning methods are applied by sectors that control and manage its supply. The distribution of water is affected by factors such as weather, geography, variations of rainfall, deforestation and a lot more. It is widely used by environmental organizations and disaster management authorities. These sections and administrators ensure water is given importance because it is the platform of life.
The template has ideal picturization to display approaches to water conservation and water supply. The line graph is perfect to show the increasing demand of water consumption throughout the years. Additionally, the slide is useful to show the measures that taken by local governments to arrest the problem of water scarcity. Water conservation involves changing the habits. Since many of these habits have evolved over several centuries ago. People can become active in conserving water by starting simply, then gradually taking more advanced steps to reduce water consumption; install a low-flow showerhead, limit shower time to 6 minutes or less, fix leaks are few suggestions from the experts. Water flow infographics PowerPoint is a symbolic representation of water related issues. User can change the PowerPoint objects and color combination and the design of water pipe and the size of water drops. This diagram is also useful to show business-related presentations and revenue returns of capital markets. The design offers 100% engagement from the viewers.