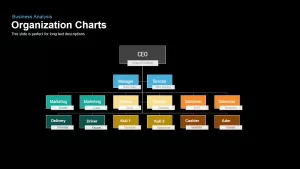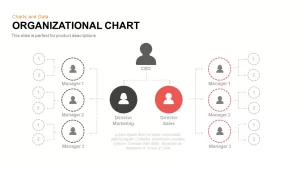
Bar Chart PowerPoint Template
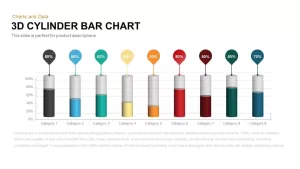
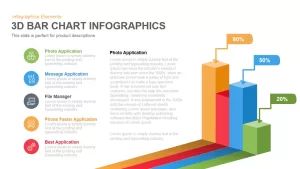
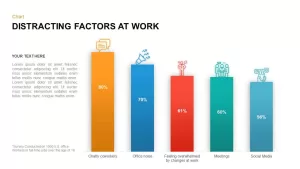
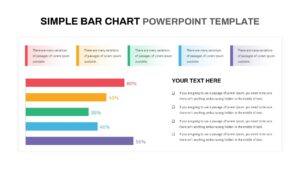
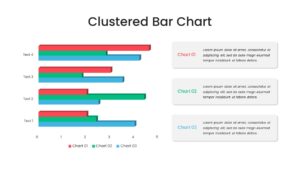
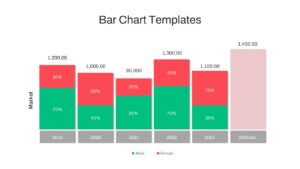
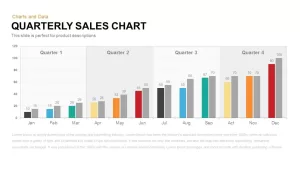
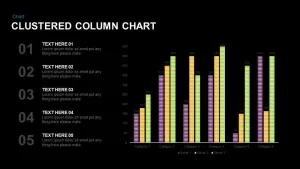
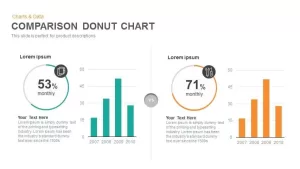
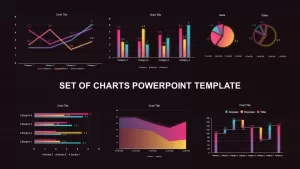
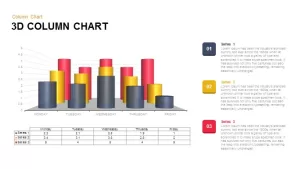
3 bar chart PowerPoint template and keynote slide contain three clusters of unequal bars that show the nature of data in your hand. Bar graphs or charts are one among many methods used to display data in a pictorial form so that the viewer may readily distinguish patterns or trends. This bar graph PowerPoint is easy to understand because it present categorical and numeric variables are clustered in class intervals. Presenters can use the bar chart template to show discrete data. Because discrete data has a clear separation between the different possible values. This vertical bar chart slide is suitable for business presentation and research-oriented presentation.
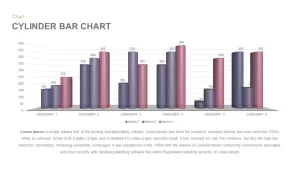
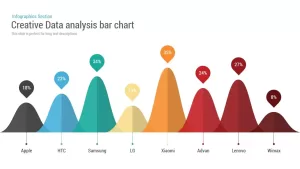
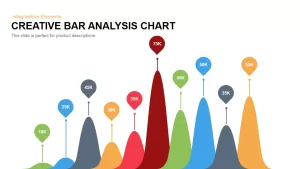
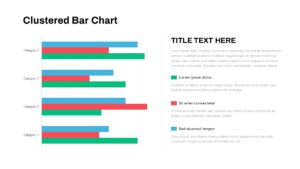
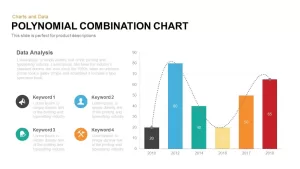
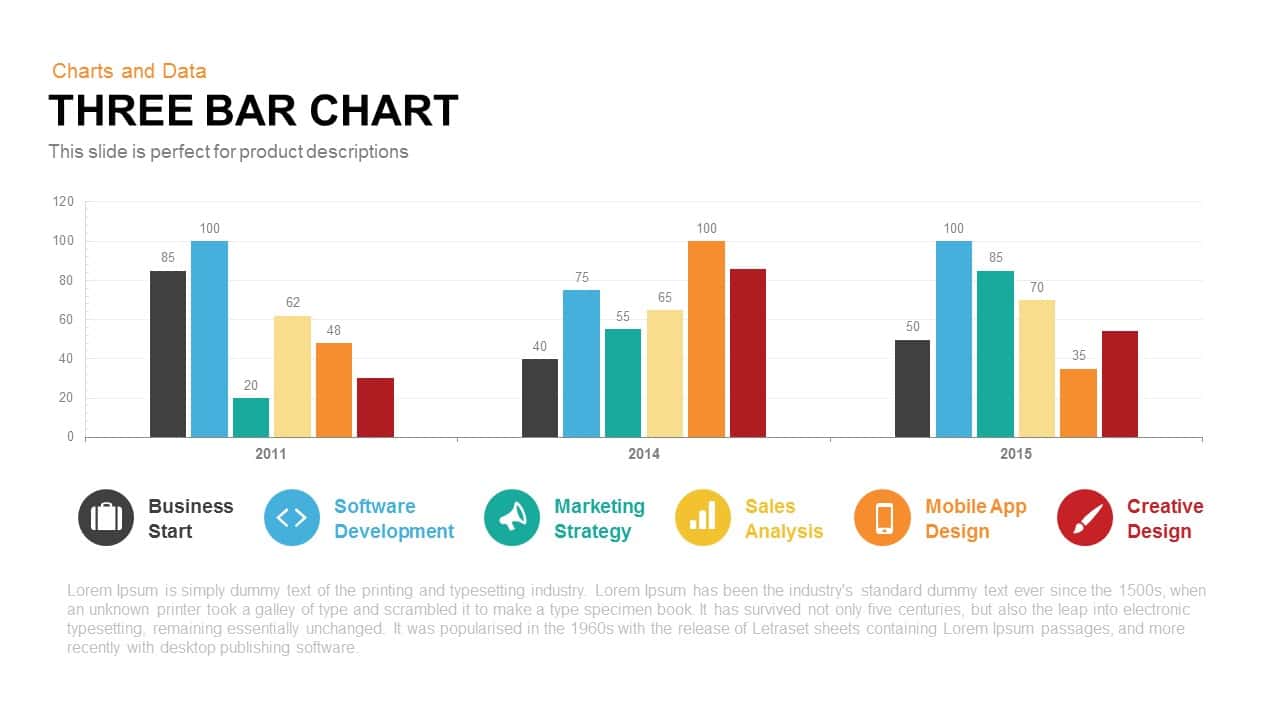
The clustered bar chart diagram shows different values by the height or length of the bar. This kind of bar graphs is typically used to display variables on a nominal or ordinal scale. The Bar charts are graphical information used to display in research reports and business analytics. The data must be presented accurately; otherwise, the reader couldn’t understand or analyze the presentation effectively.
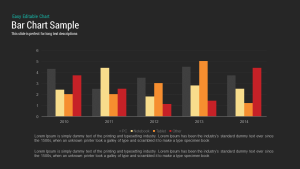
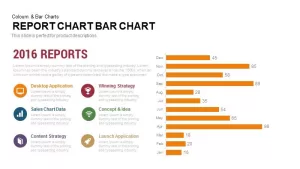
Three Bar Chart PowerPoint template is very helpful when you wish to compare the marketing strategies and sales over the years; the template is useful as you can witness their results over a span of three years in one single slide. The template is available in both white and black background and you also have a text box at the bottom of the graph to write a very detailed description of the comparison you are making in the graph. The Three Bar Chart PowerPoint template is easy to examine, digest and understand for the viewers in the presentation. This template is an editable slide. Users can customize the bars and lines according to their needs and preference. The color codes and infographic icons are also modifiable by using infographic options. Slidebaazars researchers and designers are always trying to make unique statistical tools that have sophisticated look and value. Users can search for more graphs and diagrams in our data and chart category.
You can access more Bar Chart Templates here Grab the free ppt now!