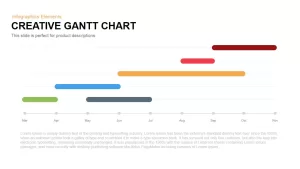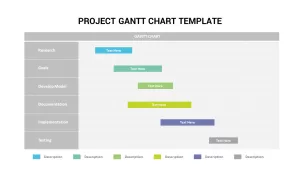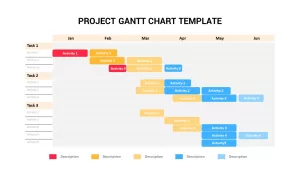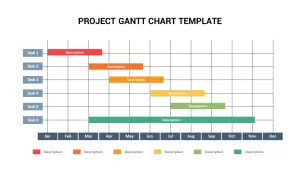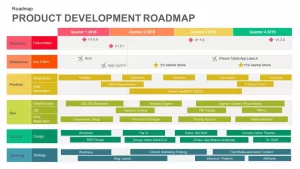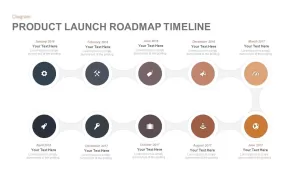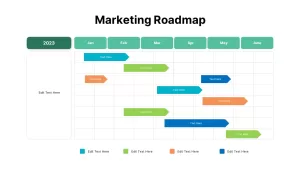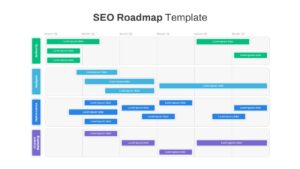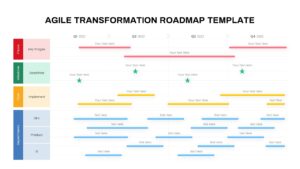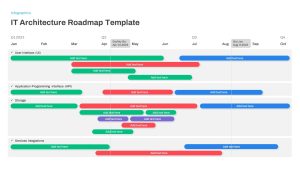
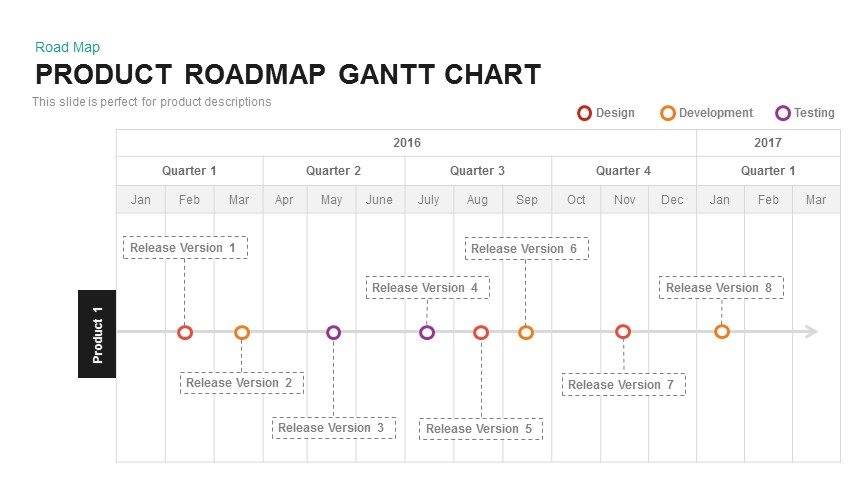
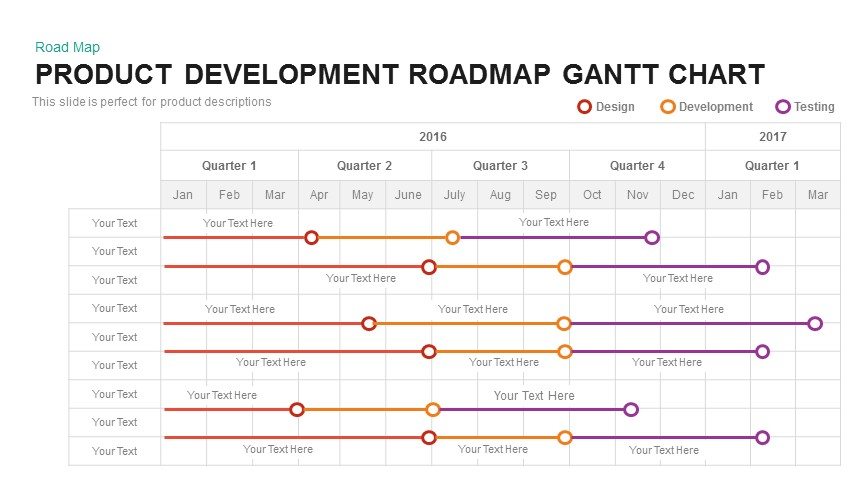
Product roadmap Gantt chart PowerPoint template and keynote slide is a statistical tool that can be used to present the phases of product development. Product Roadmap Gantt Chart PowerPoint contains seven slides. Gantt chart is a kind of bar chart with a sequence of flat parallel lines showing the amount of work completed or production done in certain periods of time in relation to the amount as devised by Henry Gantt in 1910. The bar chart shows 4 quarters and an extra quarter of two years, 2016 and 2017, and the different products; the first chart shows a straight horizontal line and various points marked in different quarters with the release versions written in dotted text boxes. These points also remain constant among other templates too, and they are Design, Development, and Testing. Our collection of 50+ Roadmap PowerPoint templates has many more designs for you to choose from.
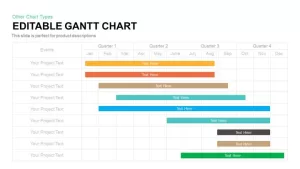
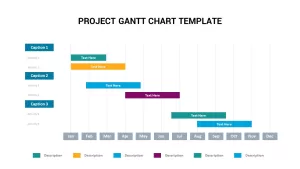
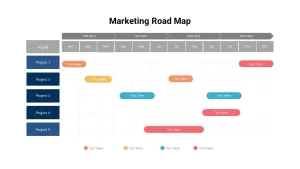
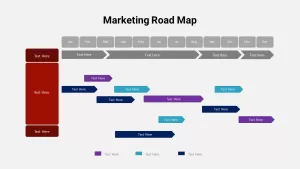
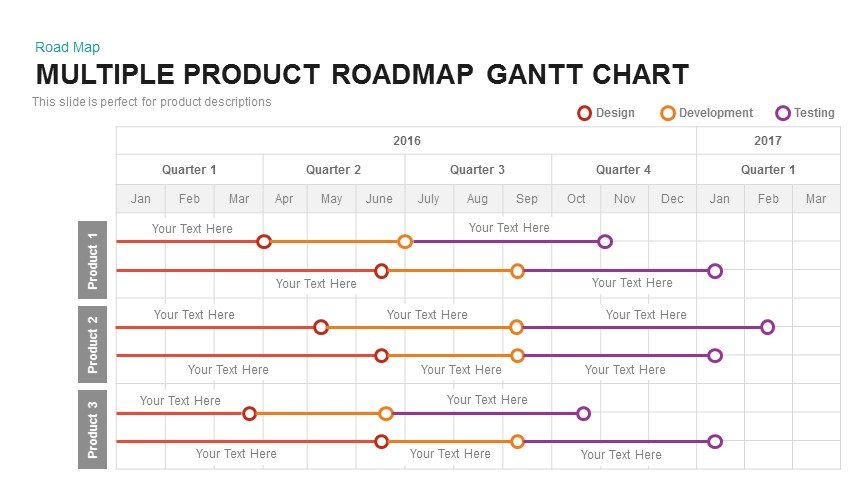
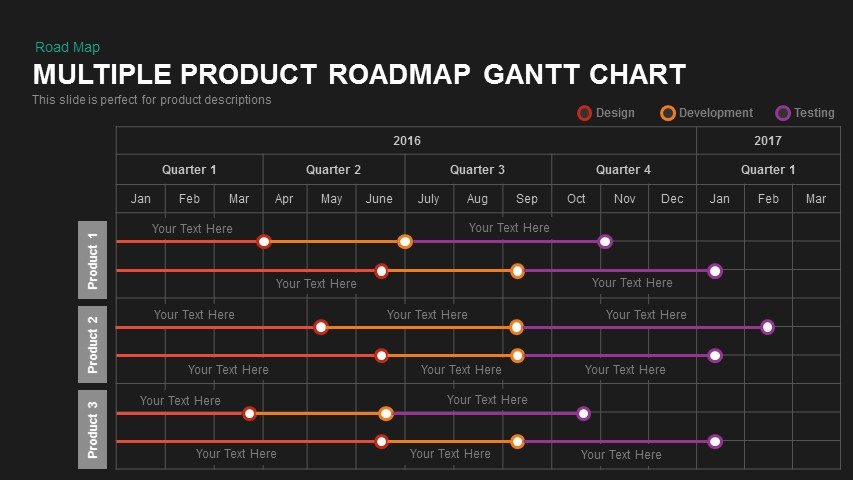
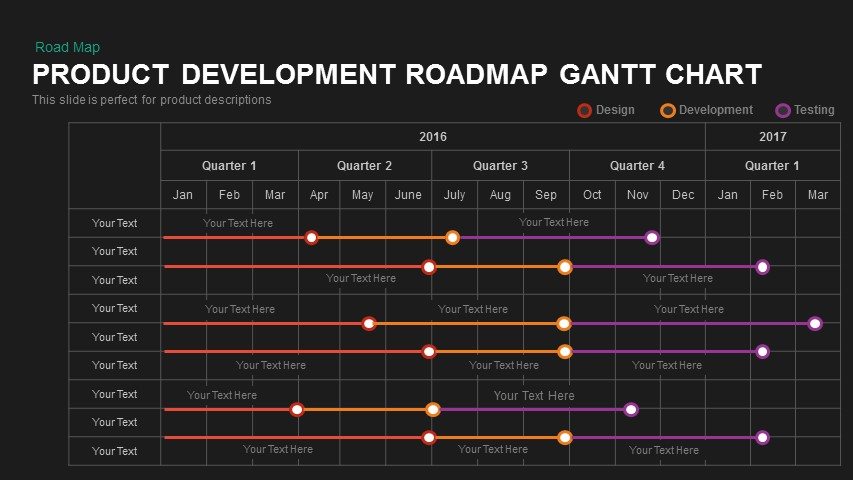
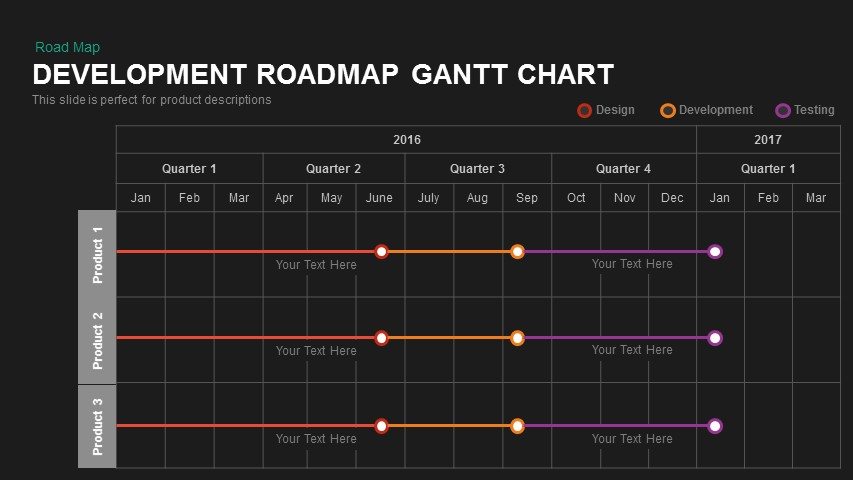
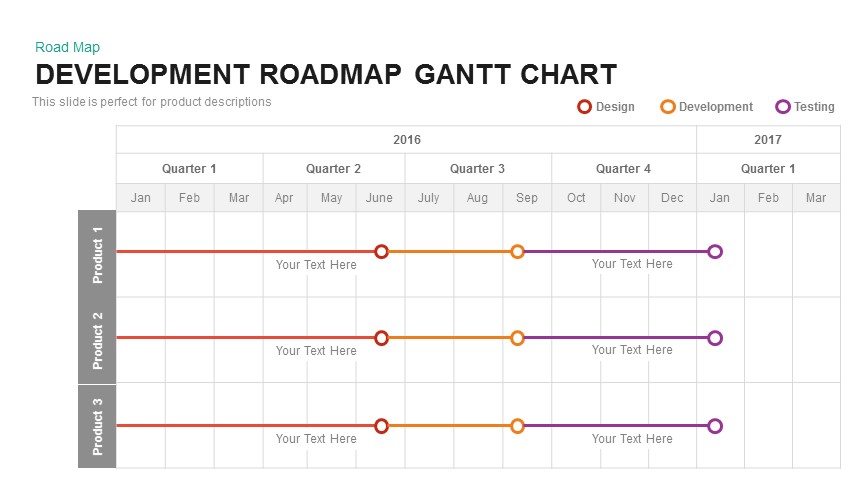
The next slide is Product Development Roadmap Gantt Chart which is similar to the first one, but it has a set of two lines going across the chart with the points in different sections as marked; you also have the option to edit in the text on the left side first column as well as beneath every line as a one-liner, The template is available in white and black background. Multiple Product Roadmap Gantt Chart is the next slide where the only difference is seen on the first column, where the variation is compared between products 1, 2, and 3; as always, the points will differ based on the units at different points of the quarters. You have the option to edit the text near the lines, and the template is available in white and black backgrounds. Development Product Roadmap Gantt Chart is the last one that its similar to the Multiple Product Gantt Chart but instead of two lines, one single line is seen while making a comparison with products 1, 2, and 3. The template is available in white and black backgrounds, and also you can edit your text beneath or above the lines.
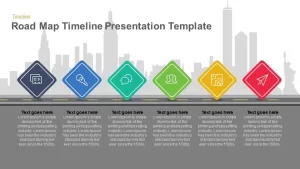
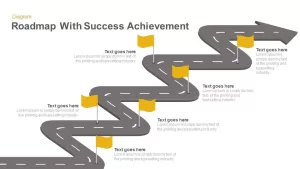
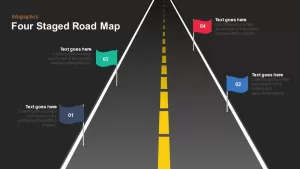
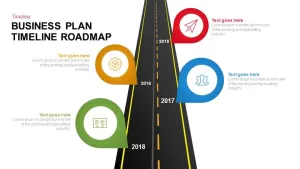
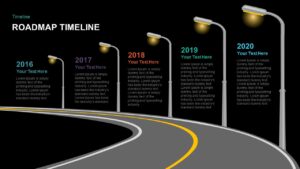
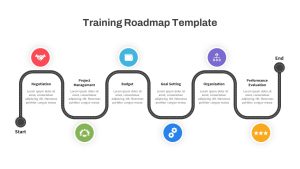
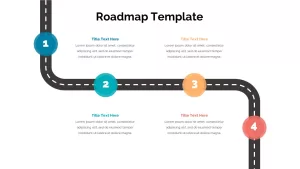
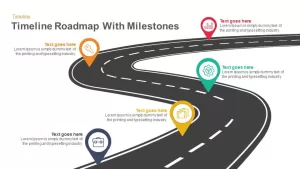
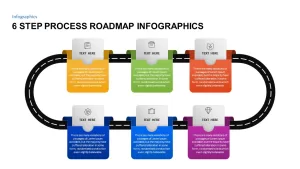
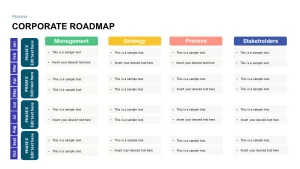
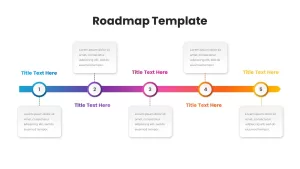
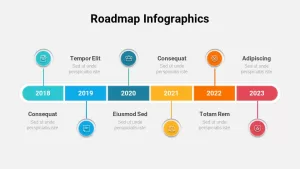
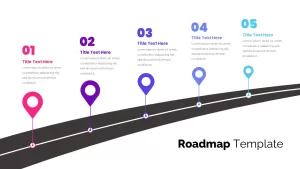
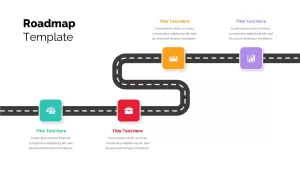
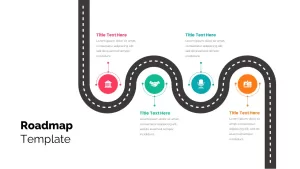
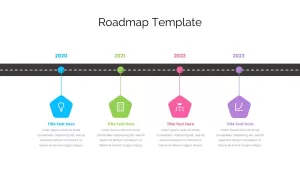
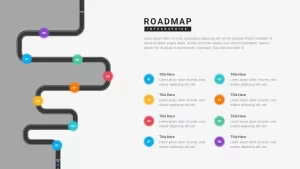
The Product Roadmap timeline Gantt chart PowerPoint may look a little complicated, but it is best to indicate a work schedule, the summary of a project, assignment completion, etc., and makes a good impression when making a presentation.