Doughnut Chart Split Deep Dive Chart - PowerPoint Template
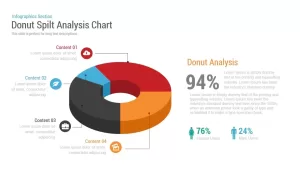
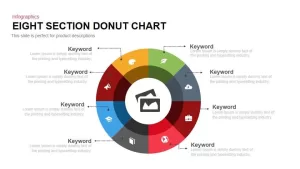
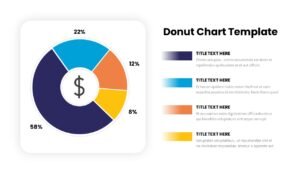
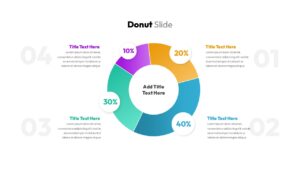
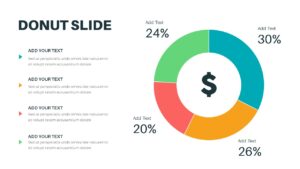
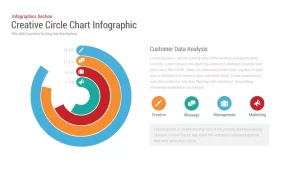
Donut chart split deep dive chart template is an unusual design to show the business statistics of an organization. Donut and pie chart are used to show the segmented distribution of a phenomenon. It can display the numerical proportion. The difference between donut and pie diagrams is not on the basis of its function but on the basis of its illustration. Donut chart designed with an empty center and has an ability to support multiple statistics at once. This blank center can be used to display additional, related data.
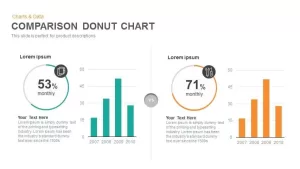
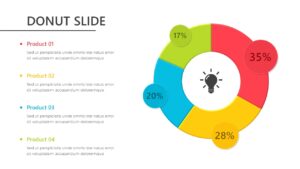
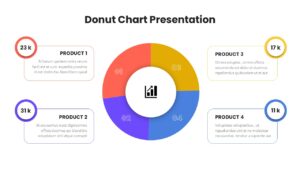
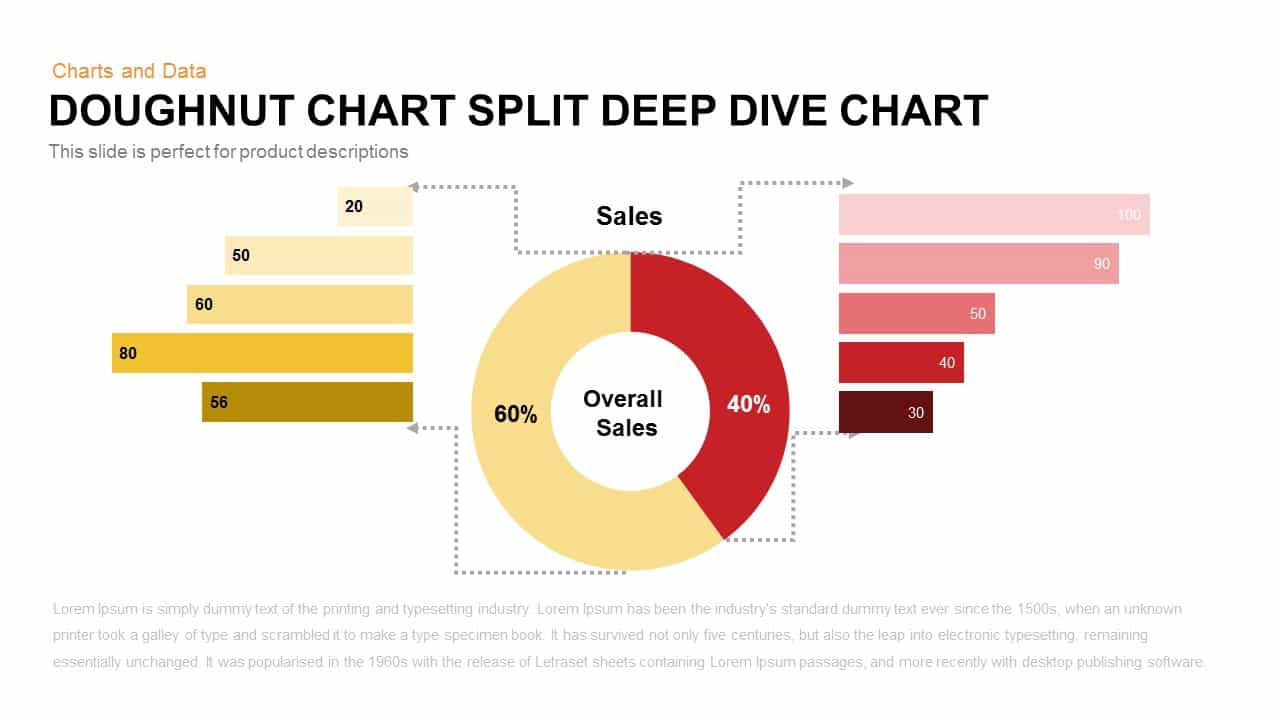
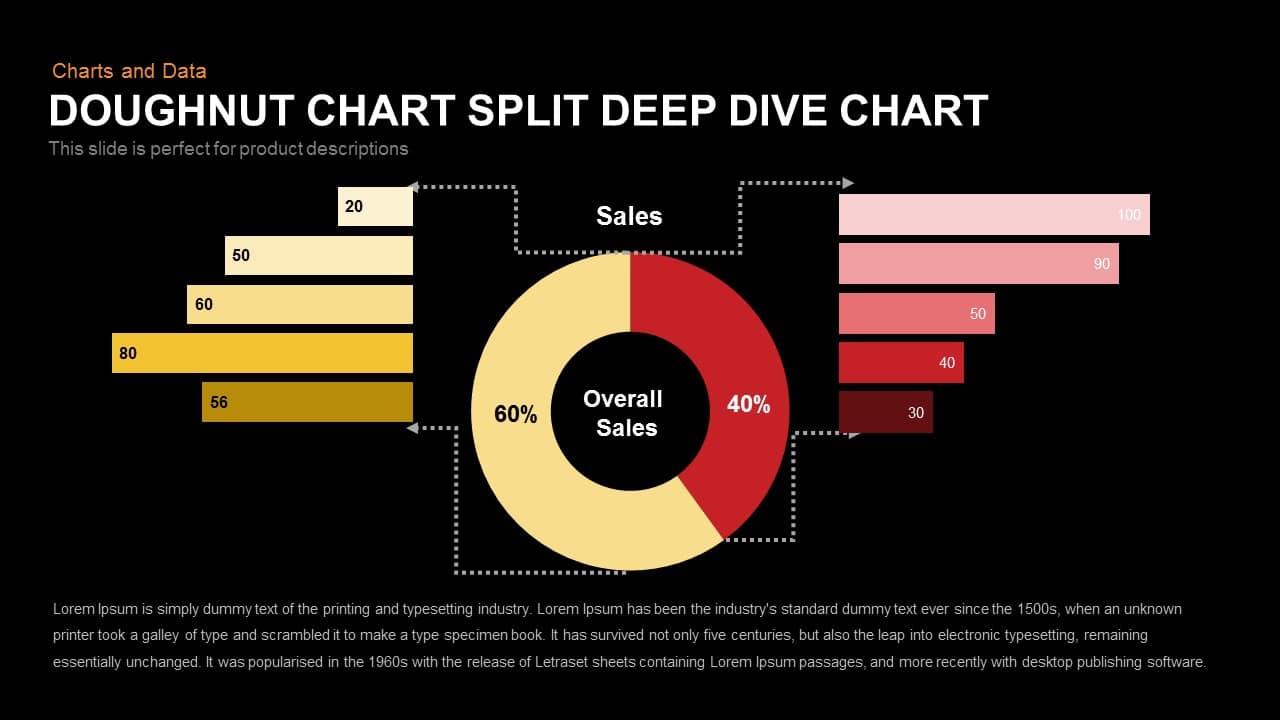
This donut chart PowerPoint template is a special design because the callouts of the diagram is suitable to present the comparison of data in a unique mode. For example, the user can split the sales data of annual basis, and compare the data by this chart diagram template. The color combination of the donut slide is perfect to show the split data comparison.
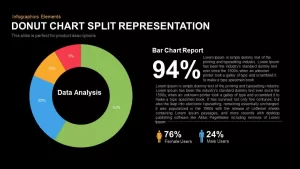
Donut Chart Split Deep Dive Chart is very advanced and inspired template which can be mainly used to show the sales and revenue gained by the company in a matter of months or a year. The template gets the name Donut Chart Split Deep Dive Chart as the inner circle is shaped in the form of a Donut and based on their figures and ratio they are split into two and each portion or ratio can be broken down in various fragments with the support of a bar chart. The Donut is shaped in light shades of pink and custard color and pink shade gives pink bar charts to one side and custard color gives shades of yellow on the other side. A text box is given below the template to write a more detailed description on the selected topic in the Donut Chart for PowerPoint; it is available in both white and black background. The chart can be used for both financial, sales; revenue as well as marketing related meetings and can be used to compare statistics and figures. The users can search and find splendid charts and diagrams from our arcade and make mind-blowing presentations. The template is designed in both PowerPoint and keynote in both the aspect ratio 4:3(Normal) and 16:9 (widescreen).