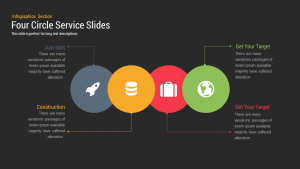
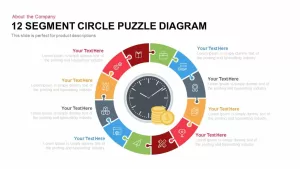
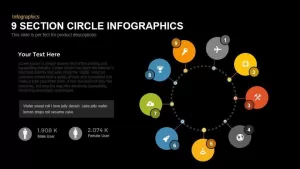
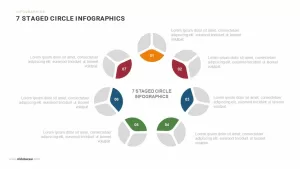
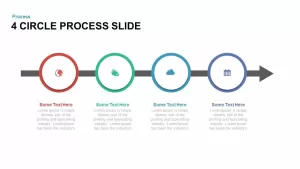
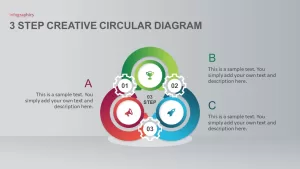
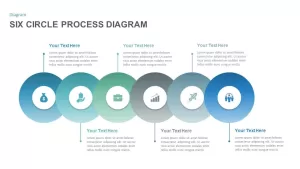
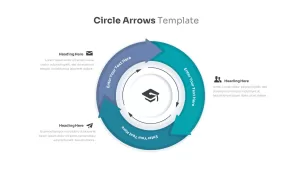
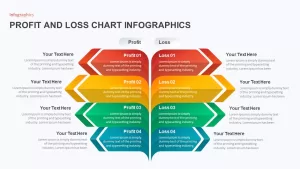
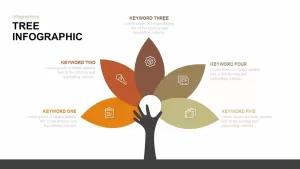
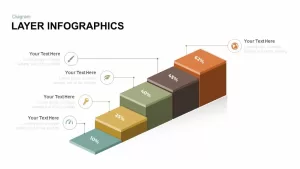
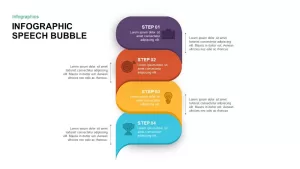
Circle Chart Infographic PowerPoint Template and Keynote
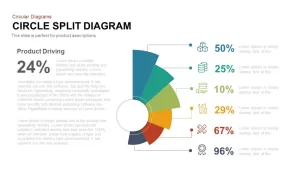
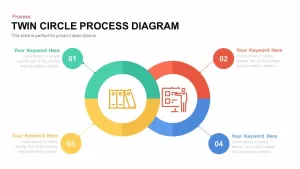
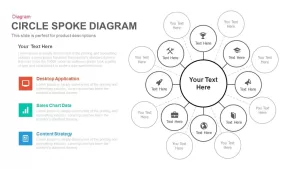
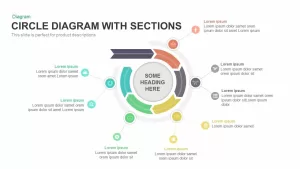
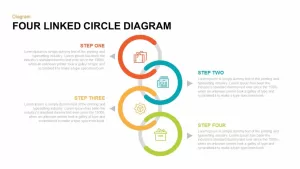
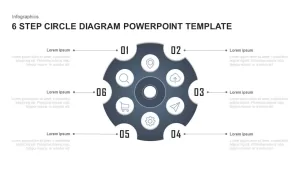
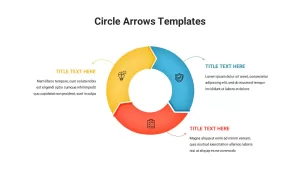
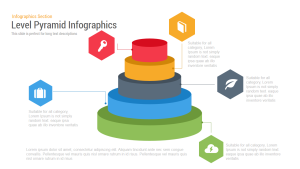
Circle chart infographic PowerPoint template and keynote has four half circles of varying sizes and color. These circles can be used to indicate a category depending on their magnitude or importance. The categories can differ upon the situations and subject like demographics, budget, planning, project management, product features, target audience, product distribution, product classification, consumer attitude towards a particular product etc. Hence, the circle chart infographic can be widely used for presentations depending upon any related subjects; slide like this will make you smarter and give the viewers also an impression. Your concepts and headings can be easily modified into the slide and presented in a very attractive manner.
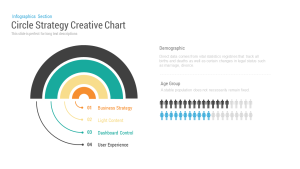
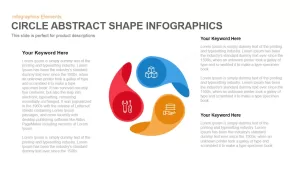
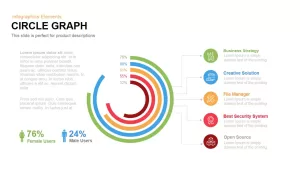
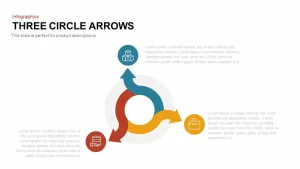
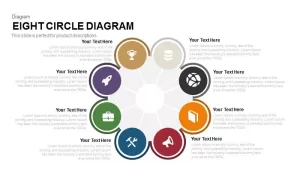
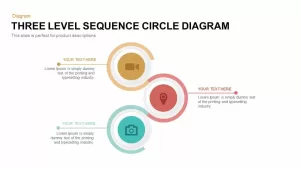
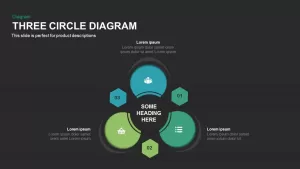
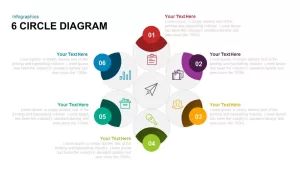
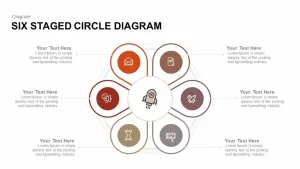
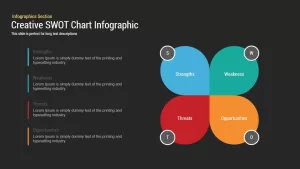
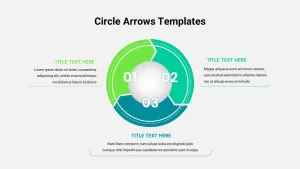
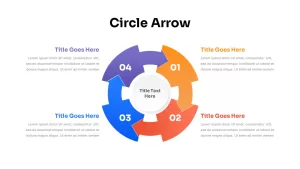
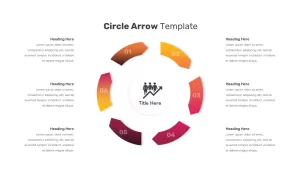
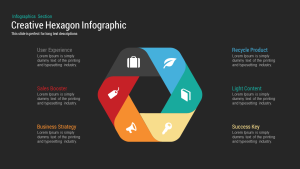
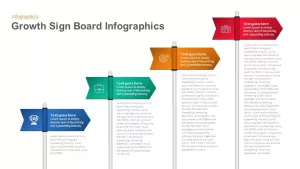
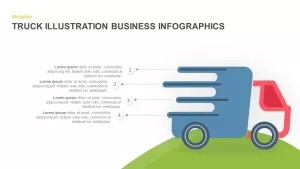
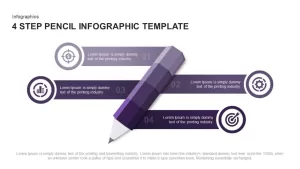
Circle strategy creative chart is a skilled design, users can give more emphasize related to the business strategy drawing. Business strategy and plans is the keystone of business accomplishment. Each and every business initiatives should develop strategies, either traditional or innovative connected with sales, marketing, product manufacturing, product development, product launching and implementation etc. apart from product sales and development, every business organizations or other establishments should develop strategies related to human resource management or employee management. Customer relations management is another area which needs unique strategies to obtain customers. So this circle chart template for powerpoint and keynote is perfect for such presentations.
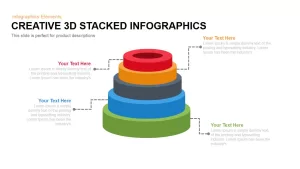
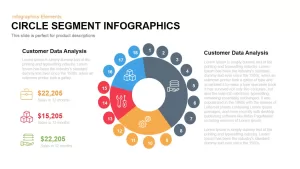
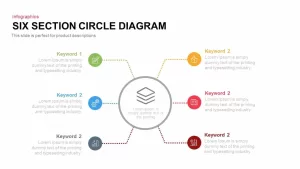
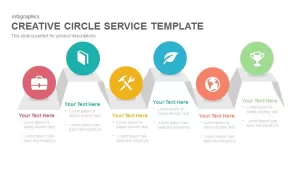
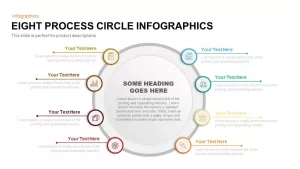
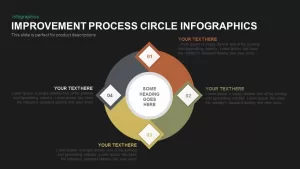
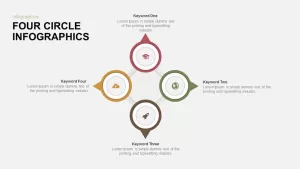
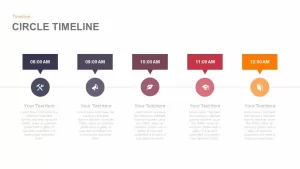
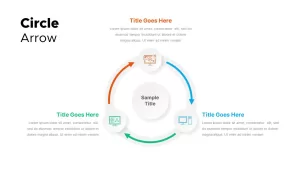
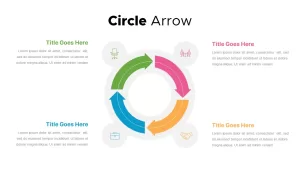
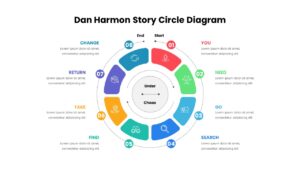
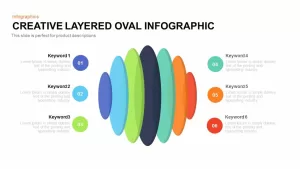
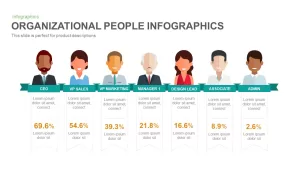
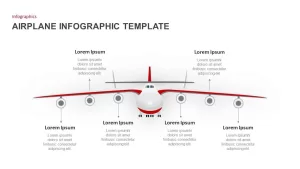
Four attractively colored semi-circles; blue, yellow, brown and green are allowing to show the concepts in a perfect tone and style... This circle chart diagram can also display the demographic distribution of a particular country. Population size, population composition, population distribution and structure of the population can be presented. Fertility and mortality character, gender participation on migration, ratio between pull and push factors can also displayed with this versatile circle chart infographic powerpoint template. Vital four topics can display on the body of each layer by replacing the icons, and its descriptions can be illustrated in the right side of the chart. Presenter can change the color themes and make overall changes in the layout. This PowerPoint ensures the maximum engagement of the audience. Users can download more semi-circles diagrams which may suitable for your next presentation.
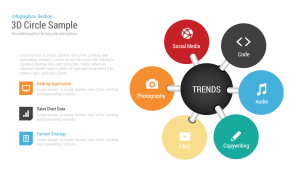
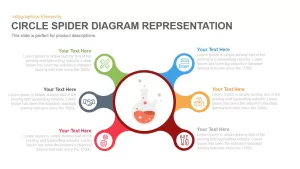
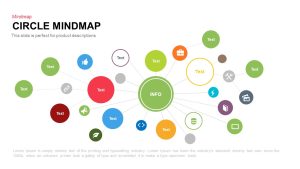
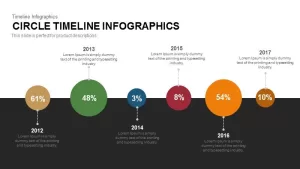
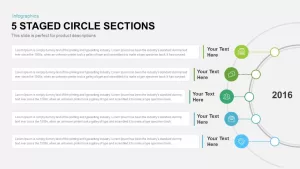
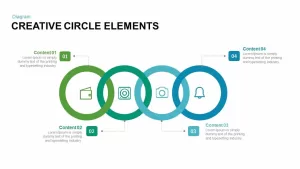
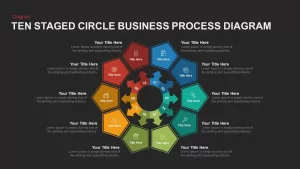
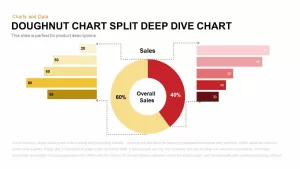
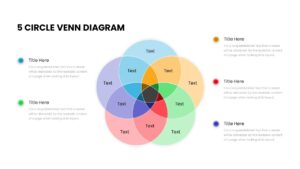
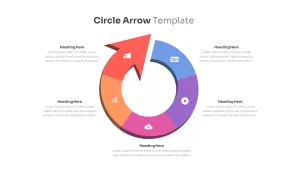
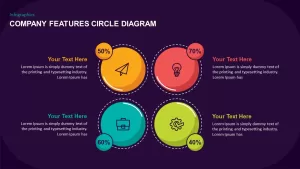
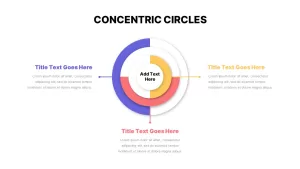
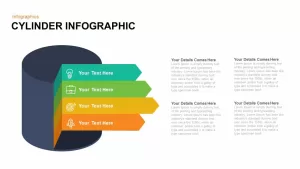
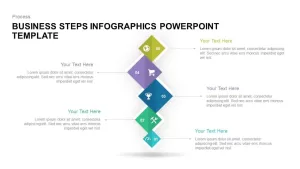
Circle Chart Infographic Powerpoint template and Keynote is having 5 donuts having data accordingly.
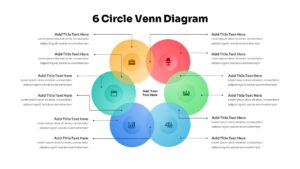
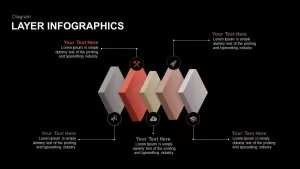
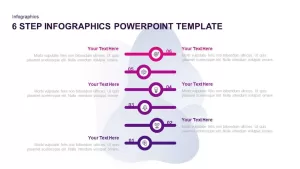
The template is designed in both powerpoint and keynote version in 16:9(widescreen) and 4:3(Normal) Version.